A study guide and course reference for ACCTMIS 3600.
Use it before class to prepare, after class to deepen your understanding, or at any point to review examples and work through practice problems at your own pace. Content may be revised or expanded from time to time as the course develops.
Written and maintained byYuheng HuDistinguished Associate Professor · Accounting & Management Information Systemsyuhenghu.com ↗
Using the study guide
Prepare, learn, review, and practice at your own pace.
This study guide brings together explanations, examples, figures, worked cases, and practice for ACCTMIS 3600. Read ahead before class to become familiar with a topic, return after class to strengthen your understanding, or use any chapter whenever you need a reference.
Open book contents
Chapter 1
Part I · Foundations
AIS and enterprise systems
An accounting information system turns business events into evidence, records, reports, and decisions.
After this chapter, you should be able to
Explain an AIS as a people-and-process system rather than merely a software package.
Distinguish data from decision-useful information.
Explain why enterprise integration improves some decisions while creating new risks.
Trace one business event from operational activity to a financial report.
Chapter roadmap
Start with the question, then build the concept
The essential question
How does an organization turn a business event into information that someone can trust and use?
Every later topic in AIS depends on this question. Databases, controls, analytics, and AI are useful only when they preserve the meaning of an economic event and make responsibility visible.
Before you begin
Recall the difference among an order, a shipment, an invoice, revenue, and cash collection.
Think of accounting records as representations of business events rather than the events themselves.
Remember that different users can need different reports from the same underlying transaction.
A productive reading sequence
Begin with the business event and identify the decision that needs support.
Follow the event through evidence, operational records, accounting records, and reports.
Identify the people, procedures, data, software, infrastructure, and controls involved.
Ask how integration improves information and how one bad rule or master-data value can spread.
Concepts to hold onto
Accounting information system
The organized combination of people, procedures, data, software, infrastructure, and controls that captures economic activity and produces information.
Data versus information
Data are recorded facts. Information is data organized, defined, and presented so that it changes what a decision maker can understand or do.
Enterprise integration
The use of shared identifiers, rules, workflows, and interfaces so that one event can update several related business processes without repeated entry.
Master data
Relatively stable facts about customers, vendors, products, employees, locations, and accounts that many transactions reuse.
1.1
What an AIS actually does
An accounting information system is the organized combination of people, procedures, data, software, infrastructure, and controls that captures economic activity and turns it into information. The word accounting can make the definition sound narrower than it is. An AIS does not begin when a journal entry is posted. It begins when a customer places an order, an employee records time, a receiver accepts goods, or a manager approves a price change.
The system must preserve meaning as the event moves through the organization. A sales order means that a customer requested goods. A shipping record means that goods left the company. An invoice means that the company billed the customer. A cash receipt means that value was collected. Those records are related, but they are not interchangeable. Good AIS design keeps the distinctions visible while connecting the records into a coherent history.
For accountants, the central question is not simply whether data were stored. It is whether the system produced information that is reliable enough for a particular decision. The same system supports operations, management reporting, financial reporting, compliance, tax, and audit. Each user may need a different view, but all views should be reconcilable to the underlying events.
Figure 1.1 · The AIS evidence chain
One event becomes several accountable representations
01OrderCustomer requests goods
02ShipmentCustody transfers
03InvoiceCustomer is billed
04LedgerAccounts are updated
05ReportA defined view supports action
Each step adds meaning, but none of the records should be confused with the underlying economic event.Check your understandingIf the sales dashboard and general ledger show different totals, does one of them have to be wrong?
No. They may use different event dates or definitions. The accountant should first compare the report purpose, population, timing, and status rules, then reconcile both totals to the underlying transactions.
1.2
From data to information to a decision
Data are recorded representations of facts: an invoice number, quantity, timestamp, account code, or approval status. Information is data organized and interpreted for a purpose. A list of 8,000 open invoices is data. An aging report that identifies customers likely to miss payment terms is information because it changes what the credit manager can see and do.
Information quality is therefore contextual. Accuracy matters, but an accurate report can still be incomplete, late, difficult to understand, or irrelevant. A controller preparing the close may need a complete population and a documented reconciliation. A sales representative speaking with one customer may need a current balance immediately. The system should serve both decisions without silently changing definitions.
Accountants add value by asking disciplined questions: What business decision is being made? Which events belong in the population? Which attributes are required? How current must the information be? What level of error is tolerable? Who should be allowed to view or change it? These questions turn a vague request for data into a controlled information requirement.
Relevant: connected to the decision being made.
Reliable: sufficiently accurate, complete, and unbiased for that use.
Timely: available before the decision loses value.
Understandable: presented with definitions, units, and context.
Verifiable: another knowledgeable person can trace or reproduce it.
1.3
Six components that must work together
AIS textbooks often list six components: people, procedures and instructions, data, software, information-technology infrastructure, and internal controls. The list is useful because failures often occur between components. A well-configured application cannot compensate for employees who share credentials. A strong approval policy cannot help if workflow rules route the transaction to the requester. Clean data will deteriorate if master-data responsibilities are unclear.
Think of the components as a chain of accountability. People perform and supervise work. Procedures define expected work. Data represent what happened. Software applies rules and transformations. Infrastructure keeps the service available and protected. Controls prevent, detect, and correct unacceptable outcomes. When investigating a problem, avoid blaming the visible software screen before considering the whole chain.
Figure 1.2 · Six AIS components
An AIS works only when its technical and organizational components fit together
01PeoplePerform, review, approve, and remain accountable
02ProceduresDefine expected work and exception handling
03DataRepresent events, entities, and status
04SoftwareApply rules, calculations, and workflows
05InfrastructureProvide secure and available processing
06ControlsPrevent, detect, correct, and recover
A failure that appears on a software screen may originate in a procedure, data definition, access decision, or missing control.
1.4
ERP integration: one model of the enterprise
An enterprise resource planning system integrates processes such as sales, purchasing, inventory, production, payroll, and financial reporting around shared data and configured rules. Integration reduces repeated entry and can make consequences visible quickly. When goods ship, the same event can update inventory, cost records, customer billing, and the general ledger rather than waiting for separate departments to reenter the transaction.
Integration does not mean every employee sees everything or that all modules are physically one program. It means the organization has designed consistent identifiers, relationships, workflows, and interfaces. The customer, product, vendor, and chart-of-accounts structures become shared organizational decisions. This is powerful because one approved change can flow everywhere. It is risky for exactly the same reason.
ERP implementation is therefore an accounting and control project, not only a technology project. Teams must decide how transactions are authorized, which fields are mandatory, when a document becomes an accounting event, how exceptions are handled, who can change configuration, and how converted data will be reconciled. Automating an unclear process usually makes the confusion move faster.
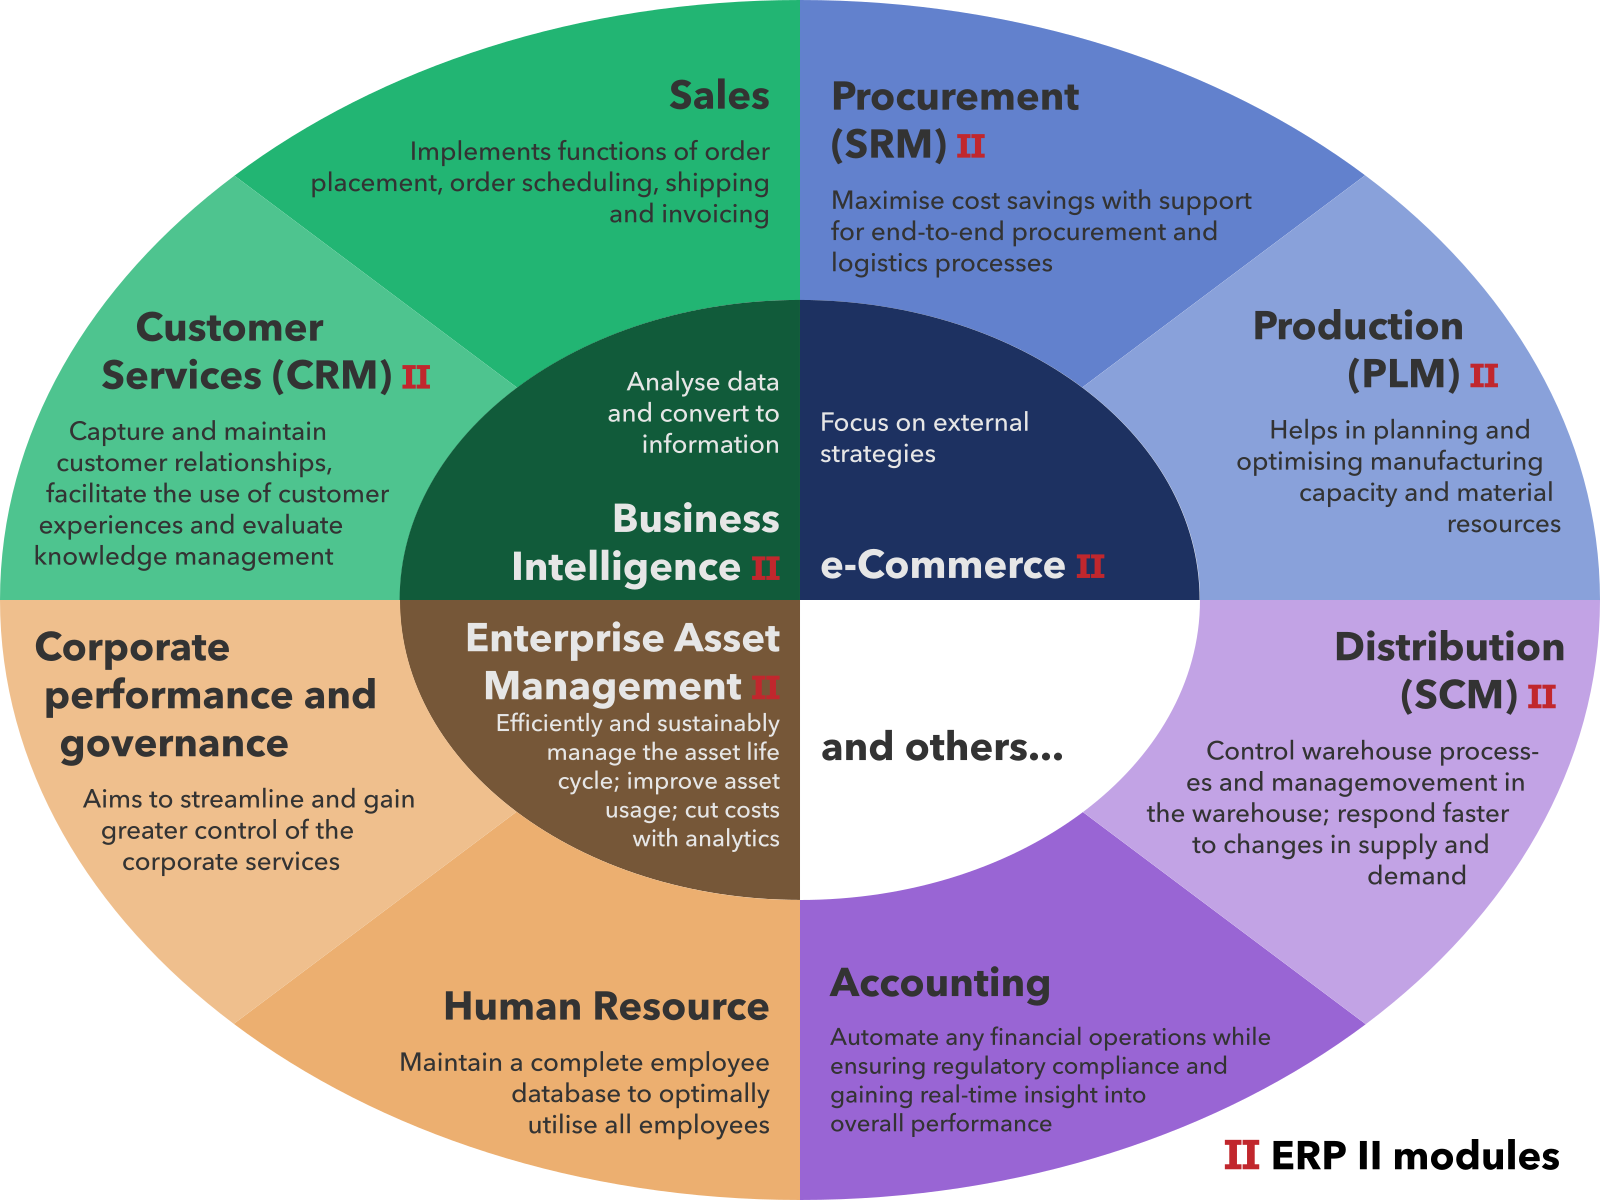
Source figure · Typical ERP modules
An ERP connects many processes around shared organizational data
The modules are drawn separately because each supports different work, but their placement around ERP emphasizes shared identifiers and cross-process consequences. Ask what happens to finance, inventory, purchasing, and reporting when one product or vendor record is wrong.Image credit: Shing Hin Yeung. Source: Wikimedia Commons. Reuse terms: CC BY-SA 3.0.
Figure 1.3 · ERP integration
One shared event can update several business views
01SalesCustomer demand and order status
02InventoryQuantity and custody change
03BillingReceivable and customer invoice
04CostingCost of goods and margin
05LedgerFinancial accounts and reporting
Integration reduces duplicate entry, but a bad master-data value or configuration rule can spread through every connected module.
1.5
The accountant’s role in system design
Accountants understand recognition, measurement, evidence, reconciliation, authorization, and accountability. Those ideas are system requirements. When a project team asks when revenue should post, how an approval threshold should work, or what evidence must survive a system change, the accountant is helping translate business meaning into data and control rules.
This role requires curiosity about operations. A journal entry is the compressed result of a longer process. To evaluate it, the accountant should be able to move backward to the subledger, source document, approval, and business event. The strongest AIS professionals can also move forward: they can explain how a change in a customer, product, or workflow field will affect reports, controls, and decisions.
Check your understandingWhat should an accountant ask before approving a new automated posting rule?
Ask which business event triggers the posting, which data determine the accounts and amount, who can change those data or the rule, how exceptions are handled, what evidence is retained, and how the resulting balance will be reconciled.
Worked case
Trace one Northstar sale from request to financial statements
On March 28, Northstar accepts a $12,000 order from a credit customer. It ships the bicycles on April 2, invoices the customer on April 3, and receives payment on May 1. Assume revenue recognition criteria are satisfied when control transfers on shipment.
Separate the events
The order records demand and an approved commitment; it is not yet a shipment, receivable, revenue, or cash receipt. Keeping the events separate prevents an order backlog from being mislabeled as revenue.
Identify evidence and ownership
The approved order supports customer, item, price, terms, and credit. The shipping record supports quantity, date, and custody transfer. The invoice supports billing, and the bank record plus remittance supports collection and application.
Follow the accounting records
The April shipment can trigger inventory relief, cost of goods sold, revenue, and accounts receivable under configured rules. The May receipt reduces cash-in-transit or unapplied cash when received and accounts receivable when correctly applied.
Explain legitimate timing differences
Sales may report March bookings, operations April shipments, accounting April revenue, and treasury May cash. The totals are not comparable until the report definition, event date, status, and population are stated.
Locate the controls
Credit approval, price authorization, shipping confirmation, interface totals, invoice sequencing, cash reconciliation, access restrictions, and exception review each address a different point in the information chain.
What the case establishes
The AIS does not create one universal number called sales. It preserves several connected events and lets each report use a documented definition that can be reconciled to evidence.
Common misconceptions
Ideas that sound plausible—but need correction
“An AIS is the accounting software.”
Software is one component. Shared passwords, unclear ownership, weak procedures, or bad master data can make well-programmed software produce unreliable information.
Integration changes reconciliation rather than eliminating it. Interfaces, configurations, subledgers, estimates, external evidence, and reporting transformations still require comparison and review.
“If two reports disagree, one must be wrong.”
They may measure different events, dates, statuses, units, or populations. First compare definitions, then determine whether the remaining difference is an error.
Mastery practice
Work the problem before opening the solution
For each problem, identify the economic event before discussing software. State assumptions explicitly and connect the operational record to an accounting or decision consequence.
Problem 1Applied
Separate an order from the events that follow
event identification
evidence
recognition
Scenario
Northstar accepts a $48,000 distributor order on September 27. Credit is approved that day. Goods costing $29,000 are shipped FOB shipping point on October 2. The system mistakenly creates the invoice on September 27, and the customer pays on November 5.
Your work
Create a timeline that distinguishes the order, credit approval, shipment, invoice, revenue recognition, receivable, and cash receipt.
Identify the evidence that should support each recorded event.
Explain the September 30 financial-statement misstatement if the invoice automatically posts revenue when created.
Recommend one system rule and one monitoring control that would prevent or detect the error.
Need a starting hint?
An approved order is evidence of demand and authorization, but it is not automatically evidence that performance obligations have been satisfied.
Reveal the worked solution
September 27 contains the order and credit approval only. October 2 contains shipment, transfer of control under the stated terms, revenue recognition, cost of goods sold, inventory relief, and the receivable. November 5 contains the cash receipt and reduction of the receivable.
Order and approval records support the commitment and credit decision; pick ticket and carrier evidence support shipment; the invoice supports billing; bank and remittance evidence support receipt and application of cash.
If revenue posts on September 27, September revenue and accounts receivable are overstated by $48,000. Cost of goods sold may also be recognized in the wrong period, depending on system configuration. The cutoff assertion fails even though the customer and amount are real.
A preventive rule should block revenue posting until a valid shipment record exists. A detective control should compare invoice dates with shipment dates around period-end and require investigation of exceptions.
Problem 2Foundation
Turn transaction data into decision-useful information
data versus information
decision framing
information quality
Scenario
A sales table contains customer ID, order date, promised date, shipment date, quantity, price, product family, salesperson, and return date. The operations director asks, ‘Are we becoming less reliable for strategic customers?’
Your work
Identify which fields are raw data and propose at least three derived measures that would become information for this decision.
Define the population, unit of analysis, comparison period, and meaning of ‘strategic customer.’
Explain how a technically correct dashboard could still mislead the director.
Need a starting hint?
A useful measure needs a defined decision, population, grain, rule, and comparison—not merely a chart.
Reveal the worked solution
All listed fields are recorded data. Useful measures could include days late, on-time shipment indicator, complete-and-on-time indicator, return rate, and trend by strategic-customer segment.
A defensible design might use each order line as the unit, completed orders promised during the current and prior quarter as the population, and an approved customer-tier field to define strategic customers. The exact choices should be documented because they change results.
The dashboard could exclude open late orders, mix lines with orders, use changed customer tiers, treat partial shipments as on time, or compare periods with different product mixes. Visual polish does not repair ambiguous definitions or incomplete populations.
Problem 3Applied
Diagnose an ERP master-data failure
ERP integration
master data
downstream effects
Scenario
A product is assigned to the wrong revenue account and an obsolete 8% tax category in the item master. During one month, 320 sales lines use the product across the web store, sales system, warehouse, billing, general ledger, and tax report.
Your work
Map how the two master-data errors can propagate through the integrated system.
Distinguish which downstream records may be operationally correct but accounting-invalid.
Design preventive, detective, and corrective responses, including who should own each response.
Need a starting hint?
Integration reduces repeated entry, which also lets one shared error travel farther and faster.
Reveal the worked solution
The correct item and quantity can flow through ordering, picking, shipment, and billing while the wrong account mapping misclassifies revenue and the obsolete tax code miscalculates customer invoices and tax liabilities. Shared master data makes the error consistent rather than correct.
Warehouse quantity and shipment evidence can be valid even when account classification and tax amounts are invalid. The analysis therefore should not label entire transactions simply correct or incorrect; validity depends on the assertion and field.
Preventive responses include restricted master-data access, approved change requests, validation against allowed account and tax mappings, and effective dates. Detective responses include change logs, exception reports, and account/tax analytics. Corrective work includes freezing the bad value, identifying all affected transactions, posting approved corrections, communicating with tax and customers when necessary, and documenting closure. Business data owners approve meaning; IT administers access and deployment; accounting and tax validate financial consequences.
Problem 4Challenge
Evaluate whether a report belongs inside the AIS
system boundary
people and procedures
accountability
Scenario
A controller downloads ERP data to a spreadsheet, adds manual exchange rates, adjusts three customer balances, and emails a weekly liquidity forecast to the CFO. The controller argues that the spreadsheet is outside the AIS because it is not part of the ERP.
Your work
Assess the controller's claim using the definition of an AIS.
Identify risks created by the workflow and evidence needed to reproduce the forecast.
Propose a proportionate control design without assuming every spreadsheet must be eliminated.
Need a starting hint?
The system boundary follows the information-producing process, not the software vendor's product boundary.
Reveal the worked solution
The spreadsheet is part of the AIS because people, procedures, ERP extracts, external rates, formulas, manual adjustments, and distribution collectively produce accounting information used for a decision.
Risks include incomplete extracts, wrong exchange-rate dates, formula changes, undocumented adjustments, version confusion, unauthorized access, and no evidence linking the forecast back to source records.
A proportionate design could use a controlled template, read-only source extract, documented rate source and date, protected formulas, separate input cells, adjustment explanations, preparer-reviewer signoff, version retention, access restrictions, and periodic back-testing. Automation may help, but ownership and review remain necessary.
Chapter review
Explain before revealing
Answer each question in your own words. Then open the explanation and compare the logic, not just the vocabulary.
01Why should an accountant begin with the business decision rather than the available data fields?
The decision determines which events, attributes, timing, accuracy, access, and evidence are relevant. Beginning with fields can produce a precise answer to the wrong question.
02Why can integration increase risk as well as efficiency?
A shared value or rule is reused broadly. One unauthorized vendor-bank change, product unit error, or configuration mistake can affect many transactions and reports quickly.
03What makes information verifiable?
A knowledgeable person can trace its definition, source records, transformations, parameters, controls, and approvals and reproduce or corroborate the result.
Chapter 2
Part I · Foundations
Transactions, processing, and audit trails
Every reported balance is the accumulated result of events, validations, transformations, and approvals.
After this chapter, you should be able to
Describe the data-processing cycle from source event to output.
Compare batch and real-time processing using accounting consequences.
Trace evidence forward from a source document and backward from a balance.
Recognize how interfaces, exceptions, and system changes can break an audit trail.
Chapter roadmap
Start with the question, then build the concept
The essential question
What must a transaction-processing system preserve so another person can reconstruct what happened?
Accounting depends on more than final balances. Managers and auditors need a reliable path from source evidence through processing, correction, posting, and reporting.
Before you begin
Distinguish a business event from the document and database record used to represent it.
Recall that authorization, custody, recording, and review are different responsibilities.
Understand that a final correct value can still hide an unauthorized or poorly controlled change.
A productive reading sequence
Study the capture, validation, recording, reporting, and reconciliation cycle.
Compare source documents by the assertion each document supports.
Contrast batch and real-time processing using timing and correction risk.
Practice tracing forward for completeness and vouching backward for occurrence.
Concepts to hold onto
Transaction
A recordable business event that changes resources, obligations, rights, status, or another fact relevant to the organization.
Source document
Evidence created at or near the event, such as an order, receiving report, time record, invoice, or bank record.
Audit trail
Linked identifiers and records that allow movement from source events to reports and from reported amounts back to supporting evidence.
Control total
An independently calculated count or amount used to determine whether a population moved through processing completely and accurately.
2.1
The transaction-processing cycle
A transaction is an event that the organization chooses to record because it affects resources, obligations, performance, or control. Transaction processing usually includes data capture, validation, processing, storage, and output. These stages may occur within seconds, but separating them helps accountants locate failures.
Capture creates the initial record. Validation tests whether required fields, formats, relationships, quantities, and authorization conditions are acceptable. Processing applies business rules such as pricing, tax, depreciation, matching, or account determination. Storage preserves the event and its status. Output makes the result available through documents, dashboards, interfaces, and journal entries.
A rejected transaction is also important accounting evidence. If a sales order fails a credit check, the system should retain enough information to explain the exception, subsequent approval, and final outcome. Otherwise management sees only completed transactions and cannot evaluate the pressure placed on controls.
Figure 2.1 · Transaction processing loop
Processing is controlled from capture through correction
01CaptureRecord the event and source
02ValidateTest format, authorization, and logic
03RecordUpdate journals, ledgers, and status
04ReportCreate operational and accounting views
05ReconcileCompare outputs with independent evidence
A rejected or corrected record returns to an earlier stage; the correction becomes part of the audit trail.
2.2
Source documents and business evidence
A source document provides evidence about a business event. It may be paper, electronic, or generated entirely inside a system. Examples include purchase requisitions, purchase orders, receiving reports, time records, sales orders, bills of lading, invoices, remittance advice, and bank confirmations. The important feature is not the visual format; it is the document’s role in establishing what happened, who participated, and when.
Different documents support different assertions. A customer purchase order supports the existence of demand but does not prove shipment. A carrier record supports dispatch but may not prove customer acceptance. An invoice shows billing, not cash collection. Accountants strengthen conclusions by matching complementary evidence rather than treating one document as proof of the entire transaction.
Electronic evidence needs identity and integrity controls. Useful metadata include creator, source system, timestamp, version, approval, status, and relationships to other records. A PDF saved without its workflow history may look authoritative while losing the information that made it reliable.
Figure 2.2 · Source evidence
Different documents prove different parts of the same transaction
01AuthorizationApproved order or requisition
02OccurrenceShipping or receiving record
03MeasurementQuantity, price, terms, and calculation
04SettlementBank record and payment application
No single document ordinarily proves authorization, occurrence, quantity, price, custody, and payment at once.
Revenue-cycle evidence and what it supports
Record
Primary question
What it does not prove alone
Sales order
What did the customer request?
That goods shipped or revenue was earned
Picking ticket
What was selected in the warehouse?
That the carrier accepted the goods
Bill of lading
What was transferred to the carrier?
That the invoice amount is correct
Sales invoice
What did the company bill?
That cash was collected
Cash receipt
What payment arrived?
Which invoice should receive the payment without remittance data
2.3
Batch and real-time processing
In batch processing, transactions accumulate and are processed together at a scheduled time. Payroll is a familiar example: approved time and employee data are collected, then gross-to-net calculations and payments are produced for the pay period. Batch processing can be efficient, predictable, and easier to control for high-volume periodic work.
In real-time processing, each accepted transaction updates relevant records immediately or nearly immediately. An online retailer may validate inventory and authorize payment while the customer waits. Real-time information can improve service and reduce stale data, but it demands high availability, carefully designed error handling, and controls that operate continuously.
Many systems are hybrid. A sale may reserve inventory immediately, settle card payments in a daily batch, and post summarized entries to the general ledger overnight. The accountant should understand the timing of each stage because cutoff, reconciliation, and availability risks follow the actual architecture rather than the label attached to the system.
2.4
Following an audit trail in both directions
An audit trail is the set of relationships and evidence that allows a user to connect a reported result to its underlying events and connect an event to its effects. Vouching begins with a recorded amount and moves backward toward source evidence. It is commonly associated with testing existence or occurrence. Tracing begins with source evidence and moves forward into records and reports. It is commonly associated with testing completeness.
The distinction is practical. Selecting revenue entries from the general ledger and finding invoices may show that recorded revenue has support, but it cannot identify shipments that were never invoiced or posted. To investigate completeness, the accountant needs a population that begins earlier in the process, such as shipping records, and traces those items forward.
Modern audit trails include more than document IDs. They may include event logs, interface message IDs, old and new values, automated rule results, user identities, and timestamps. Because administrators may have powerful access, logs should be protected from unauthorized alteration and monitored for gaps.
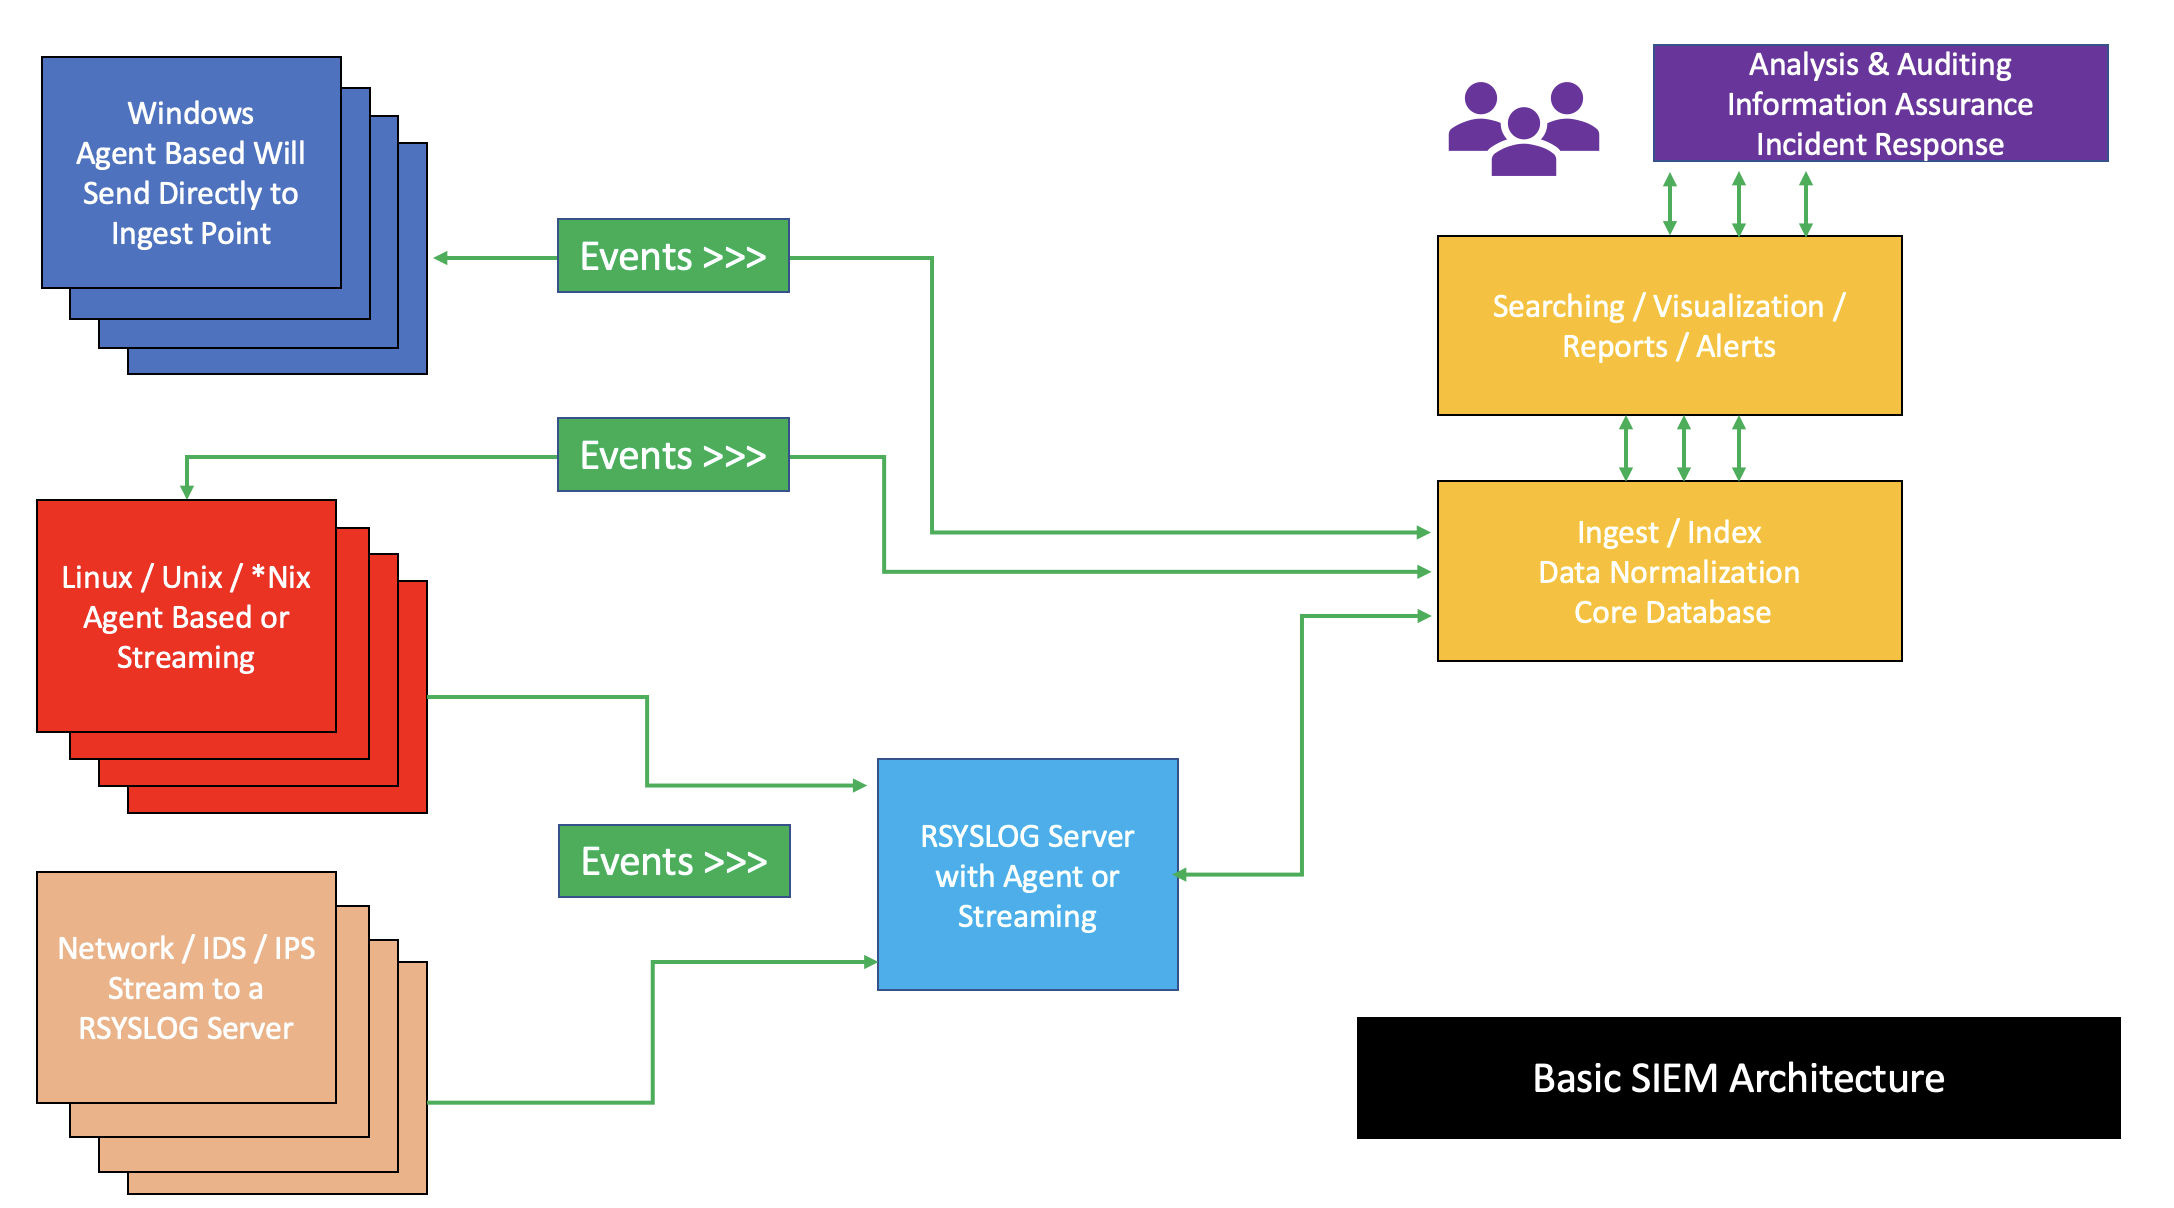
Source figure · Event-log architecture
Useful audit evidence must be collected, preserved, and searchable
This security-log architecture is not a complete accounting audit trail, but it makes an important systems idea visible: events from many sources must be captured, indexed, protected, and connected to investigation. An accounting trail also needs document relationships, before-and-after values, user identity, timestamps, and evidence that logging remained complete.Image credit: Jbuchanan 1. Source: Wikimedia Commons. Reuse terms: CC BY-SA 4.0.
Figure 2.3 · Two directions through an audit trail
01Source eventOrder, receipt, shipment, time, or authorization
02Transaction recordValidated operational record with identifiers
03Journal and subledgerDetailed accounting classification
04General ledgerSummarized account balance
05Financial reportPresented amount and disclosure
The same linked records support movement from source events to reports and from reported amounts back to underlying evidence.Check your understandingWhy is matching every recorded invoice to a shipping record insufficient to test revenue completeness?
Because the test begins with recorded invoices. A shipment omitted from billing and accounting would never enter the sample. A completeness test should begin with shipping records and trace them to invoices and the ledger.
2.5
Controls over input, processing, and output
Input controls help ensure that captured data are authorized, complete, and plausible. Examples include required fields, valid-value lists, check digits, format tests, reasonableness limits, duplicate checks, and batch control totals. Processing controls help ensure that rules execute completely and accurately. Examples include run-to-run totals, sequence checks, recalculation, interface acknowledgments, and exception logs. Output controls restrict distribution, identify report parameters, and ensure that recipients review the information.
No validation rule understands the business automatically. A reasonableness limit of $50,000 may detect an extra zero in ordinary purchases but block a legitimate equipment acquisition. The system therefore needs an exception path with appropriate approval and a record of the override. Controls should make unusual transactions visible without pretending that unusual means wrong.
2.6
System change is a controlled business event
Configuration changes, new interfaces, data conversions, and software releases can affect financial reporting even when no accounting policy changes. A small mapping change may redirect thousands of transactions. Change management therefore requires documented requests, impact analysis, testing, approval, migration controls, and post-implementation monitoring.
User acceptance testing should reflect real business scenarios, including exceptions and period-end conditions. Testing only the happy path can prove that the system works when everything is correct while revealing nothing about rejected transactions, overrides, reversals, duplicate messages, or failed interfaces. Accountants are valuable testers because they know which outcomes must reconcile.
Check your understandingWhat is the strongest evidence that a converted accounts-receivable balance is complete and accurate?
A documented reconciliation from the legacy subledger to the converted customer-level detail and new control account, including investigation and approval of differences—not merely a screenshot showing that the new system opened successfully.
Worked case
Diagnose a missing invoice after a successful shipment
Northstar ships order SO-18422 on June 29. Inventory is reduced, but no customer invoice appears and no receivable is recorded by June 30. The billing interface reports that 1,248 records were processed successfully.
Start from the source population
Obtain the authorized shipping population for June 29–30, not merely the billing output. Completeness is tested by beginning with events that should have entered the next process.
Trace the transaction identifier
Use order ID, shipment ID, customer ID, and interface batch ID to follow the event. Confirm that the shipment record contains the required billable status and was included in the interface selection.
Interpret the control total correctly
A processed count of 1,248 does not prove completeness unless it is compared with the independently expected count. If 1,249 eligible shipments existed, the interface total reveals the missing record.
Review rejection and correction evidence
The record failed because the customer tax code was blank. The system should preserve the original rejected value, error message, time, user or process, correction, approval, and successful resubmission.
Assess accounting consequences
Determine whether revenue and receivables are understated at June 30, whether cutoff adjustment is needed, and whether similar rejected shipments exist. Correct the source or interface rule rather than only posting a manual journal entry.
What the case establishes
A successful output count is not enough. A reliable transaction system reconciles expected input to accepted, rejected, corrected, and posted records while preserving every material change.
Common misconceptions
Ideas that sound plausible—but need correction
“The final database value is the audit trail.”
The final value shows current state. An audit trail also preserves origin, prior values, changes, actors, timing, authorization, and relationships to other records.
“Real-time processing is automatically more accurate than batch processing.”
Real-time processing is faster, but bad data can spread immediately. Accuracy depends on validation, authorization, exception handling, reconciliation, and recovery.
“Vouching and tracing are interchangeable words.”
Vouching commonly moves from a recorded amount back to evidence and emphasizes occurrence. Tracing commonly moves from source evidence forward and emphasizes completeness.
Mastery practice
Work the problem before opening the solution
Reconstruct what happened from evidence. For every proposed control, name the error it addresses and the evidence the control should leave behind.
Problem 1Applied
Reconstruct a disputed customer return
audit trail
source documents
record linkage
Scenario
A customer disputes a $6,400 balance. The system shows invoice I-8821, return authorization RA-417, warehouse receipt WR-309, credit memo CM-771, and cash application CA-920. The credit memo is for only $4,800, and the warehouse receipt has no condition code.
Your work
Put the records in a logical sequence and state what business event each record represents.
Identify the unresolved questions and additional evidence needed before changing the balance.
Explain how document identifiers and timestamps strengthen—or fail to strengthen—the audit trail.
Need a starting hint?
A chain of identifiers proves that records are connected; it does not by itself prove that quantities, condition, prices, or approvals are correct.
Reveal the worked solution
The invoice records billing; return authorization approves a proposed return; warehouse receipt records physical receipt; credit memo records the accounting reduction; cash application records how the customer's payment was applied. Dates and references should show the sequence and links.
The team must determine authorized versus received quantity, product condition, price and restocking terms, approval for the $4,800 credit, and whether the remaining $1,600 is valid. Carrier evidence, item-level counts, inspection evidence, approval logs, and customer correspondence may be needed.
Unique IDs, user IDs, immutable timestamps, and cross-references improve completeness and traceability. They are weak if users can alter them, if required fields are blank, or if the system links documents without validating quantity and authorization.
Problem 2Applied
Reconcile a batch with control totals
batch processing
control totals
reconciliation
Scenario
A payroll input batch contains 248 timecards, 9,876.5 hours, and $286,430 of expected gross pay. The processing report shows 247 accepted records, 9,858.5 hours, $285,782 gross pay, one rejected record, and no duplicate-record warning. The rejected employee's card contains 18 hours and $648 gross pay.
Your work
Reconcile record count, hours, and gross pay.
Determine whether the processing report is internally consistent.
Describe the next action and the evidence required before posting payroll.
Need a starting hint?
Subtract the rejected record from every expected control total, not only from the record count.
Reveal the worked solution
Expected accepted records are 247, expected accepted hours are 9,858.5, and expected accepted gross pay is $285,782. All three values agree with the processing report.
The report is arithmetically consistent, but that does not mean payroll is complete. A real employee's timecard remains unprocessed.
The batch should not be treated as complete until the rejection reason is investigated, corrected by an authorized person, reprocessed, and included in a new reconciliation. Retain the original control totals, rejection log, correction approval, rerun totals, and final posting evidence.
Problem 3Foundation
Choose between vouching and tracing
vouching
tracing
assertions
Scenario
An auditor is concerned about both fictitious sales and unrecorded shipments during the final week of the year.
Your work
Design one test beginning with recorded sales and one beginning with shipping evidence.
Connect each direction to the relevant financial-statement assertion.
Explain why performing only one direction leaves an important risk untested.
Need a starting hint?
The starting population determines which missing or unsupported items the procedure can find.
Reveal the worked solution
Select recorded sales and vouch backward to approved orders, shipping evidence, customer, quantity, price, and transfer date to test occurrence and cutoff. Select shipping records and trace forward to invoices, sales journal, receivables, and the general ledger to test completeness and cutoff.
Vouching can find recorded entries lacking valid support; tracing can find valid source events omitted from the records.
Testing only recorded sales cannot identify a shipment missing from the sales population. Testing only shipments cannot establish that every recorded sale represents a genuine shipment. Both directions are needed when both overstatement and understatement risks matter.
Problem 4Challenge
Investigate an interface control failure
interfaces
completeness
error handling
Scenario
The warehouse system sent 12,410 shipment lines to billing overnight. Billing accepted 12,386, rejected 19 for invalid customer IDs, and logged five as duplicates. The general ledger received 12,380 billing lines. The interface dashboard is green because every job completed.
Your work
Reconcile the populations across the three systems.
Explain why job completion is not an adequate control objective.
Design an exception workflow that prevents rejected or missing records from disappearing between teams.
Need a starting hint?
Availability answers whether the job ran; completeness and validity answer whether the right records arrived and were accepted exactly once.
Reveal the worked solution
Warehouse-to-billing reconciles: 12,386 accepted + 19 rejected + 5 duplicates = 12,410 sent. Billing-to-ledger does not reconcile because six accepted billing lines are not represented in the ledger feed, assuming one ledger line per accepted billing line.
A completed job can process an incomplete file, reject valid activity, duplicate records, or fail during the second interface. A green technical status therefore is not evidence of complete accounting processing.
The workflow should retain sent, accepted, duplicate, rejected, and posted control totals; assign each exception to an owner; prohibit silent deletion; require documented correction or justified exclusion; retry idempotently; age unresolved items; escalate period-end exceptions; and preserve evidence of reconciliation and closure.
Chapter review
Explain before revealing
Answer each question in your own words. Then open the explanation and compare the logic, not just the vocabulary.
01Why is an invoice alone incomplete evidence for a sale?
It documents billing but does not by itself prove customer authorization, delivery, correct quantity, custody transfer, collectability, or cash receipt.
02What should happen to rejected transactions?
They should be logged, assigned, investigated, corrected under authorization, resubmitted, reconciled, and monitored so rejection does not become silent omission.
03How can a system produce the correct total for the wrong reasons?
Omissions and duplicates can offset, wrong classifications can net to the same total, or the correct amount can come from an incomplete population. Row-level and process evidence are still necessary.
Chapter 3
Part II · Data
Relational databases and data modeling
A database preserves business facts by storing each kind of fact in the right place and connecting related facts with keys.
After this chapter, you should be able to
Explain tables, records, fields, primary keys, and foreign keys in business terms.
Recognize one-to-many and many-to-many relationships.
Explain how normalization reduces update, insert, and delete anomalies.
Connect master-data governance to transaction accuracy and control.
Chapter roadmap
Start with the question, then build the concept
The essential question
How should business facts be structured so they remain consistent, connected, and traceable?
Relational design determines whether transactions can be validated, joined, updated, and audited. SQL and analytics become unreliable when entities, keys, relationships, or grain are misunderstood.
Before you begin
Be able to name business objects such as customer, order, product, invoice, receipt, and employee.
Distinguish a fact about an entity from a fact about a particular transaction.
Recognize that repeating the same fact across many spreadsheet rows creates update risk.
A productive reading sequence
Identify entities, their attributes, and stable unique keys.
State relationships and cardinality in business language before drawing tables.
Use normalization to place each fact with the entity or event it describes.
Connect master data, transactional data, warehouses, and lineage to reporting reliability.
Concepts to hold onto
Primary key
An attribute or combination of attributes that uniquely identifies one row in its table and should remain stable for that record.
Foreign key
An attribute that refers to a key in another table and represents a business relationship between the rows.
Cardinality
The permitted number of related records—for example, one customer may have many orders, while each order belongs to one customer.
Normalization
A disciplined approach to storing each kind of fact in an appropriate table so harmful repetition and update contradictions are reduced.
Data lineage
Documentation of where a value originated, how it changed, and which reports, models, or decisions used it.
3.1
Why a database is more than a large spreadsheet
A spreadsheet combines data, formulas, presentation, and user judgment in a flexible file. That flexibility is valuable for analysis, forecasting, and small controlled tasks. A database is designed to serve many users and applications while enforcing relationships, valid values, access rules, and durable transactions. It separates the stored facts from the many reports that can be built from them.
The difference matters when the data become operational. If thousands of users create orders while inventory, credit limits, approvals, and audit logs must remain consistent, one shared spreadsheet is not a reliable transaction system. If a controller wants to explore a 2,000-row export and test alternative assumptions, a spreadsheet may be the better tool. The goal is not to declare one superior; it is to match the tool to the responsibility.
A database management system also controls concurrency. Two users can attempt to update related records without silently overwriting one another. Transactions can commit as a complete unit or roll back when a required step fails. Those features support accounting integrity even though users rarely see them.
3.2
Entities, attributes, and keys
An entity is a distinguishable person, place, object, event, or concept about which the organization stores data. Customers, vendors, products, employees, sales orders, invoices, and payments are common entities. An attribute describes an entity: a customer has a name and credit limit; an invoice has a date and amount.
A primary key uniquely identifies each record in a table. The key should be stable and non-null. A foreign key stores the primary key of a related record, creating an enforceable relationship. The words primary and foreign describe roles, not importance. A customer ID is primary in the customer table and foreign in the sales-order table.
Keys represent business promises. A unique invoice ID promises that the organization can distinguish each invoice. A foreign-key constraint promises that an order cannot refer to a nonexistent customer. When a design relies on names instead of stable identifiers, spelling changes and duplicates can break those promises.
Figure 3.1 · From business object to database row
Entities, attributes, and keys describe different aspects of a record
The entity is the thing of interest, attributes describe it, and a key distinguishes one instance from every other instance.
A small order-to-cash schema
Table
Primary key
Important foreign keys
Selected attributes
customers
customer_id
—
name, credit_limit, status
sales_orders
order_id
customer_id
order_date, status
order_lines
order_id + line_no
order_id, product_id
quantity, unit_price
shipments
shipment_id
order_id
ship_date, carrier
invoices
invoice_id
order_id
invoice_date, amount, balance_due
cash_receipts
receipt_id
customer_id
receipt_date, amount
3.3
Relationships and business rules
Cardinality describes how many records of one entity can be associated with another. One customer can place many sales orders, while each sales order belongs to one customer. That is a one-to-many relationship. A sales order can contain many products, and a product can appear on many sales orders. That many-to-many relationship is resolved through an order-line table.
Optionality is equally important. Must every invoice relate to a sales order? Must every customer have at least one order? The answer depends on the business process. A database diagram should express these rules because they determine which records are valid and which exceptions deserve attention.
Accounting relationships are not always one-to-one. One cash receipt may settle several invoices, and one invoice may be paid through several receipts. A receipt-application table can represent that many-to-many relationship and preserve the amount applied to each invoice. Trying to place one receipt ID directly on the invoice would lose legitimate business cases.
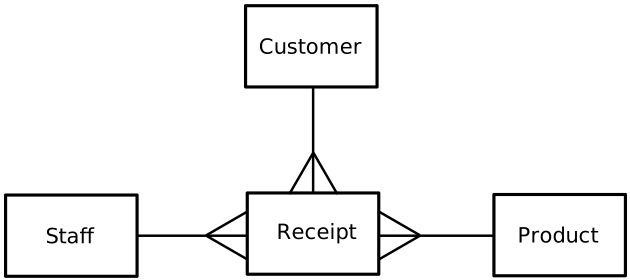
Source figure · Entity-relationship model
A database diagram turns business rules into relationships
Read each line as a business rule: one customer can have many receipts, while each receipt belongs to one customer. Then challenge the design. If a real receipt can contain many products, a receipt-line entity is needed; the diagram becomes a useful prompt for discovering missing structure rather than a template to copy blindly.Image credit: Pluke. Source: Wikimedia Commons. Reuse terms: CC0 1.0.
Figure 3.2 · Relational structure
Keys connect facts without repeating every fact
01CustomerCustomerID · name · terms
02Sales orderOrderID · CustomerID · date
03Order lineOrderID · ProductID · quantity
04ProductProductID · description · price
Customer and product facts live once in master tables; the order line connects them to a particular transaction.
3.4
Normalization as disciplined fact storage
Normalization organizes data so that each fact is stored in an appropriate relation and harmful repetition is reduced. Students sometimes experience normalization as a collection of abstract rules. A more useful intuition is to ask: What does this fact describe, and where should it change? A vendor payment term describes the vendor relationship; the quantity received describes a specific receipt line.
Poor designs create update anomalies when the same fact must be changed in many rows, insert anomalies when one fact cannot be recorded without an unrelated event, and delete anomalies when removing one event accidentally removes a separate fact. Normalization reduces these contradictions by separating entities and connecting them through keys.
Normalization does not mean splitting data without limit. Reporting systems may intentionally use denormalized structures for speed and accessibility. The accounting question is whether the structure preserves definitions, lineage, and controlled transformation from the authoritative sources.
Figure 3.3 · Why facts are separated
Normalization stores each kind of fact where it belongs
01Vendor tableVendorID · name · address · payment terms
03Invoice tableInvoiceID · VendorID · date · amount
04ResultOne address update; many invoices remain linked
Separating vendor facts from invoice facts reduces contradictory updates while keys preserve the relationship.Check your understandingWhy should invoice amount remain in the invoice table even if it can be calculated from lines?
It depends on the design and control purpose. A stored invoice total can preserve the amount issued and support reconciliation to calculated lines, but the system must define which value is authoritative and how differences are prevented or detected.
3.5
Master data, governance, and lineage
Master data describe relatively stable business objects such as customers, vendors, products, employees, locations, and accounts. Transaction rules rely on these records. A vendor bank account determines where cash goes. A product classification may determine tax and revenue reporting. An employee pay rate affects every subsequent payroll calculation.
Because master-data changes have repeated downstream effects, organizations assign ownership and stewardship. The owner is accountable for definitions, permitted use, and quality. A steward maintains standards and resolves issues. System controls restrict additions and changes, require evidence and approval, and log old and new values.
Data lineage explains where a value originated, how it was transformed, and where it was used. Lineage is essential when a reported balance appears wrong. Without it, teams may correct the final report while leaving the source field or transformation unchanged. With it, they can identify affected transactions, repair the source, rerun the process, and document the correction.
3.6
Operational databases and data warehouses
Operational databases support current business activity. They are optimized to enter orders, update inventory, record receipts, and maintain consistent transactions. Analytical repositories such as data warehouses integrate historical information from multiple sources and organize it for reporting and analysis.
Data are commonly extracted from source systems, transformed to standard definitions and formats, and loaded into the analytical environment. The process does not automatically resolve disagreements. If two divisions define active customer differently, combining their records produces a larger disagreement unless governance establishes a common definition or clearly preserves both.
Accountants should reconcile analytical outputs to authoritative sources and understand transformation logic. A dashboard total may be mathematically correct for the warehouse but still differ from the general ledger because of timing, currency conversion, excluded statuses, or mapping rules.
Check your understandingWhy might a warehouse sales total legitimately differ from current ERP sales?
The warehouse may load on a schedule, preserve historical exchange rates, exclude reversals differently, or use a governed analytical definition. The difference should be explainable through documented timing and transformation rules.
Worked case
Redesign a spreadsheet that mixes vendor and invoice facts
Northstar keeps one spreadsheet with Vendor Name, Address, Payment Terms, Invoice Number, Invoice Date, Invoice Amount, and Payment Status. The same vendor address appears on hundreds of invoice rows, sometimes with different spellings.
Identify the entities
Vendor describes a continuing business party. Invoice describes one billing event. Payment or payment application may be another entity when one payment covers several invoices or one invoice receives several payments.
Assign keys
Give each vendor a stable VendorID and each invoice a unique InvoiceID. Do not rely on vendor name as a key because names can change, repeat, or be entered inconsistently.
Place attributes with what they describe
Vendor address and default payment terms belong in Vendor. Invoice date and amount belong in Invoice. Payment status may be derived from invoice amount and valid applications rather than typed repeatedly.
Define relationships and integrity
Invoice.VendorID references Vendor.VendorID. The database should prevent an invoice for a nonexistent vendor and should restrict deleting a vendor that still has related records.
Preserve history intentionally
If the invoice must show the address or terms effective when issued, store an approved snapshot or effective-dated record. Normalization does not mean overwriting facts that must remain historically accurate.
What the case establishes
The redesign reduces contradictory vendor facts, supports controlled master-data changes, and creates explicit relationships that SQL can join without guessing from text names.
Common misconceptions
Ideas that sound plausible—but need correction
“A primary key is simply the first column.”
Its location is irrelevant. A primary key is selected because it uniquely and stably identifies a row and satisfies the database's integrity rules.
“Normalization means no fact is ever repeated.”
Keys repeat legitimately to represent relationships. Historical snapshots and analytical structures may also repeat controlled facts for a defined purpose.
“A database cannot contain duplicates.”
A database prevents only the duplicates its constraints define. Two vendor rows can represent the same real vendor when matching identifiers and governance are weak.
Mastery practice
Work the problem before opening the solution
Draw or describe the data model before proposing a query. State each table's grain and test whether every key and relationship preserves that grain.
Problem 1Foundation
Design keys for an order database
primary keys
foreign keys
grain
Scenario
Northstar wants tables for Customer, SalesOrder, SalesOrderLine, Product, Shipment, and ShipmentLine. One order can contain many products, and a line can be fulfilled by several partial shipments.
Your work
State the grain and propose a primary key for each table.
Identify the foreign keys needed to connect the tables.
Explain why ProductID alone cannot be the primary key of SalesOrderLine or ShipmentLine.
Need a starting hint?
A line belongs to a parent document. The same product can appear in many documents and may even appear more than once in one document.
Reveal the worked solution
Customer is one row per customer with CustomerID; Product is one row per product with ProductID; SalesOrder is one row per order with OrderID; SalesOrderLine is one row per order line with either OrderLineID or the composite OrderID plus LineNumber; Shipment is one row per shipment with ShipmentID; ShipmentLine is one row per shipment line with ShipmentLineID or ShipmentID plus LineNumber.
SalesOrder carries CustomerID. SalesOrderLine carries OrderID and ProductID. Shipment should carry the relevant order or customer relationship according to business rules. ShipmentLine carries ShipmentID, ProductID, and ideally OrderLineID so partial fulfillment can be reconciled to the original demand.
ProductID identifies a product, not a transaction line. Using it as the line key would prevent the same product from appearing across orders and would collapse distinct quantities, prices, promises, and shipments.
Problem 2Applied
Normalize a vendor-payment worksheet
normalization
update anomalies
master data
Scenario
A worksheet has one row per payment and repeats VendorName, Address, TaxID, BankAccount, Invoice1, Invoice1Amount, Invoice2, Invoice2Amount, ApproverName, and ApproverEmail.
Your work
Identify repeating groups and at least three update, insertion, or deletion anomalies.
Propose normalized tables and relationships.
Identify sensitive fields and controls needed even after normalization.
Need a starting hint?
Separate stable entities from events, and replace Invoice1/Invoice2 columns with rows in a relationship table.
Reveal the worked solution
Invoice1 and Invoice2 form a repeating group. Vendor address or bank changes require many updates; a vendor cannot be inserted without a payment; deleting the last payment can erase vendor information; approver email can become inconsistent; a third invoice has nowhere to go.
A reasonable design includes Vendor, VendorBankAccount, Invoice, Payment, PaymentApplication linking payments to invoices, Employee or User, and PaymentApproval linking payments to approvers. Each table has one defined grain and foreign keys connect events to master data.
Tax IDs and bank accounts remain sensitive. Controls should restrict viewing and changes, require independent bank-change verification and approval, retain effective dates and change history, encrypt sensitive values, and monitor unusual changes before payments.
Problem 3Challenge
Prevent a many-to-many join explosion
cardinality
bridge tables
join diagnostics
Scenario
Invoice I-100 has three invoice lines and two cash applications. An analyst joins InvoiceLine to CashApplication using InvoiceID and then sums LineAmount and AppliedAmount.
Your work
Predict how many joined rows invoice I-100 produces.
Explain which totals become overstated and by what multiplication logic.
Propose two valid analytical designs depending on the question being asked.
Need a starting hint?
Every line pairs with every application when both child tables are joined through the same parent.
Reveal the worked solution
The join produces six rows: three invoice lines multiplied by two applications.
Each line amount appears twice, so invoice value is doubled. Each applied amount appears three times, so cash applications are tripled. DISTINCT is not a general repair because legitimately equal values may exist.
For invoice-level balances, aggregate invoice lines to one row per invoice and applications to one row per invoice before joining. For allocation-level analysis, use a PaymentApplication table that links a payment to a specific invoice, and join only at the supported grain. If applications truly belong to invoice rather than line, do not pretend a line-level allocation exists.
Problem 4Applied
Preserve lineage through a customer merge
data lineage
master-data governance
history
Scenario
Customer C-184 and C-992 are determined to be duplicates. The team wants to overwrite every historical transaction with C-184 and delete C-992 before quarter-end reporting.
Your work
Identify the reporting benefit and the audit-trail risk of the proposal.
Design a merge process that preserves history and enables consolidated reporting.
List evidence an auditor or controller should be able to inspect later.
Need a starting hint?
Consolidated identity can be represented without erasing the identifier that was valid when the event was recorded.
Reveal the worked solution
A merge can prevent double-counting customers and consolidate exposure, but overwriting historical keys destroys the original record context, can break document references, and hides when and why identity changed.
Retain both source customer IDs, mark the duplicate inactive, create an approved cross-reference to a surviving or enterprise customer ID, use effective dates, and let reporting roll both IDs to the consolidated identity. Apply carefully governed changes to open transactions only when business rules require them.
Evidence should include the merge request, duplicate rationale, approvals, before-and-after values, affected-record counts, effective time, user or process ID, cross-reference, reconciliation of balances, downstream update results, and any exceptions.
Chapter review
Explain before revealing
Answer each question in your own words. Then open the explanation and compare the logic, not just the vocabulary.
01Why is a composite key sometimes necessary?
One attribute may not uniquely identify the event. An order line can require OrderID plus LineNumber because each value alone repeats.
02What is an update anomaly?
A fact stored in many rows must be changed repeatedly, allowing some copies to remain outdated and contradict the others.
03Why do accountants care about referential integrity?
It prevents orphan or invalid relationships, such as an invoice assigned to a nonexistent vendor, and supports complete, interpretable joins and audit trails.
Chapter 4
Part II · Data
SQL for accounting questions
SQL is a precise way to describe the rows, relationships, calculations, and exceptions needed for an accounting decision.
After this chapter, you should be able to
Translate a business question into an explicit output grain and population.
Use SELECT, FROM, WHERE, JOIN, GROUP BY, and HAVING conceptually.
Recognize duplicate and missing-row risks created by joins.
Design exception queries that support investigation rather than merely producing totals.
Chapter roadmap
Start with the question, then build the concept
The essential question
How can an accounting question be translated into a query without changing the intended population or meaning?
SQL executes definitions exactly, including bad definitions. Accountants must specify grain, joins, dates, statuses, null handling, calculations, and reconciliation before treating query output as evidence.
Be able to state what one output row should represent before selecting fields.
Distinguish orders, shipments, invoices, receipts, and recognized revenue.
A productive reading sequence
Write the business specification: decision, population, date, grain, fields, and measurement.
Use FROM and JOIN to construct candidate rows, then inspect whether relationships multiply or omit records.
Use WHERE for row-level inclusion, GROUP BY for output groups, and HAVING for group-level conditions.
Validate identifiers, row counts, totals, known cases, missing matches, source, environment, and parameters.
Concepts to hold onto
Output grain
The business meaning of one result row, such as one invoice, one invoice line, one customer-month, or one exception.
JOIN
An operation that relates rows through a stated condition. The relationship's cardinality determines whether rows match once, multiply, or remain unmatched.
WHERE versus HAVING
WHERE filters individual rows before grouping. HAVING filters groups after aggregate values such as SUM or COUNT have been calculated.
NULL
A marker for missing or inapplicable information. It is not zero or blank text and requires explicit logic such as IS NULL.
Outer join
A join that preserves unmatched rows from a selected side, making missing relationships visible for exception analysis.
4.1
Define the output before writing the query
A strong query begins with a business specification, not a keyword. State what one output row should represent. Is it one row per invoice, customer, product, or month? Then identify the required fields, source entities, population criteria, calculation rules, and ordering. This output grain prevents accidental duplication and makes the query reviewable by someone who does not write SQL.
The phrase show me sales is not yet a specification. Does sales mean orders, shipments, recognized revenue, invoices, or cash receipts? Are canceled orders excluded? Which date defines the period? Are amounts gross or net of returns? SQL will execute an imprecise definition with perfect obedience, so the accountant must make the definition explicit first.
Treat a query like a small accounting policy. The SQL should reveal how the population and measurement were implemented, and the output should include identifiers that allow unusual rows to be traced to evidence.
Figure 4.1 · Query design sequence
Define the accounting question before writing SQL
01DecisionWho will use the result, and why?
02PopulationWhich events and dates belong?
03GrainWhat does one output row represent?
04LogicWhich joins, filters, and calculations apply?
05ValidationWhich counts and totals should reconcile?
A clear population and output grain prevent many errors that syntactically correct SQL cannot reveal.
4.2
SELECT, FROM, and WHERE
SELECT describes the columns or calculations to return. FROM identifies the table or joined tables that supply the rows. WHERE filters individual source rows before grouping. ORDER BY controls presentation but does not change which rows qualify. Reading a query in these logical pieces helps a reviewer connect syntax to the business definition.
Filters deserve special attention. Dates may include time components; text statuses may contain unexpected values; blank and null are not the same; and a condition on the wrong date can change cutoff. A query for invoices dated through June 30 answers a different question from a query for goods shipped through June 30.
Figure 4.2 · Reading a basic SQL statement
Each clause answers a different part of the accounting request
01FROMWhich table or related tables contain the candidate rows?
02WHEREWhich individual rows belong in the population?
03SELECTWhich identifiers, facts, and calculations should be returned?
04ORDER BYHow should the same qualifying rows be presented?
SQL becomes easier to review when students translate every clause into population, evidence, measurement, and presentation language.
Illustrative SQL
SELECT invoice_id, customer_id, invoice_date, balance_due
FROM invoices
WHERE balance_due > 0
  AND invoice_date <= '2026-06-30'
ORDER BY balance_due DESC;
4.3
JOIN: connecting facts without copying them
A join combines related rows using a condition, usually a primary-key-to-foreign-key relationship. Customer names live in the customer table while invoices live in the invoice table. Joining through customer ID allows the report to display both without repeating the customer name in every stored invoice record.
The most important join risk is an unexpected relationship. If one invoice has five line items, joining invoice headers to lines produces five rows for that invoice. Summing the header amount after the join multiplies it by five. The SQL may run without error while the accounting result is materially wrong.
Before joining, state the expected cardinality and test it. Count rows before and after the join, look for unmatched keys, and verify whether the output grain changed. A technically valid join is not automatically a valid accounting analysis.
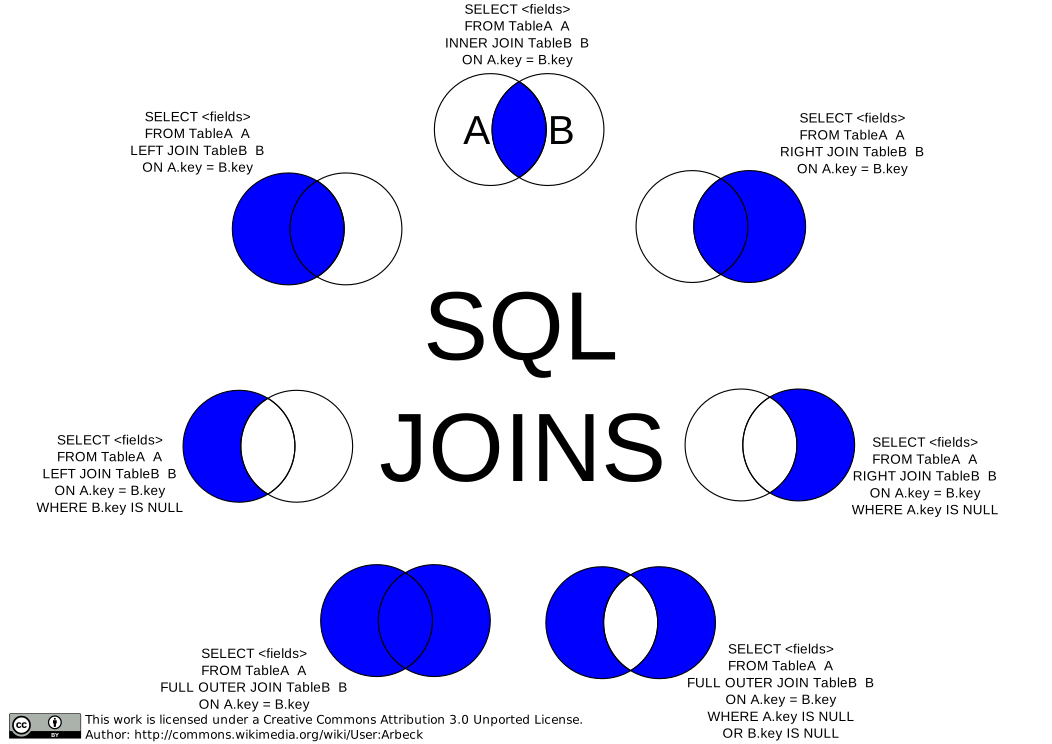
Source figure · SQL join patterns
A join rule determines which unmatched rows remain
Use the shaded regions to reason about row retention. Then return to keys and table grain: these set diagrams do not show the row multiplication that can occur in one-to-many joins.Image credit: Arbeck. Source: Wikimedia Commons. Reuse terms: CC BY 3.0.
Figure 4.3 · What a join does
Match rows through a key, then verify the resulting grain
01OrdersOne row per order
02Join keyOrderID = OrderID
03Order linesMany rows per order
04ResultOne row per order line
05ControlCount, total, and reconcile
A join does not merely add columns. One-to-many relationships can multiply rows and therefore change totals.
Illustrative SQL
SELECT c.customer_id, c.customer_name,
       i.invoice_id, i.balance_due
FROM customers AS c
JOIN invoices AS i
  ON i.customer_id = c.customer_id
WHERE i.balance_due > 0;
Check your understandingWhat should you examine first when a total becomes larger after adding a table?
Check the relationship and output grain. A one-to-many join may have duplicated the amount from the one side. Compare row counts and inspect how many matches each original record received.
4.4
Aggregation and groups
Aggregate functions summarize rows. SUM adds amounts, COUNT measures records, AVG calculates a mean, and MIN or MAX identifies extremes. GROUP BY defines the categories for which summaries are produced. Every selected field that is not aggregated normally belongs in the grouping definition.
WHERE filters source rows before aggregation. HAVING filters groups after aggregation. If the task is to find customers whose total open balance exceeds $25,000, WHERE first restricts the population to open invoices and HAVING then evaluates each customer’s grouped total.
Reconcile aggregates. A summary by region should tie to the same population summarized without region unless there is a documented category such as unknown or intercompany. A grand total that does not reconcile is a diagnostic signal, not a formatting inconvenience.
Figure 4.4 · From transactions to grouped totals
Aggregation changes the grain of the result
01Invoice linesMany detailed source rows
02FilterKeep the defined period and statuses
03GroupCreate one group per customer
04AggregateSUM amount; COUNT invoices
05HAVINGKeep groups whose total exceeds the threshold
GROUP BY defines one output row per group; aggregate functions summarize the source rows inside each group.
Illustrative SQL
SELECT customer_id,
       SUM(balance_due) AS total_open_balance,
       COUNT(*) AS open_invoice_count
FROM invoices
WHERE balance_due > 0
GROUP BY customer_id
HAVING SUM(balance_due) > 25000
ORDER BY total_open_balance DESC;
4.5
Outer joins and missing relationships
An inner join returns only rows with matches on both sides. That is useful when matched records define the population, but it can silently remove the exceptions an accountant cares about. A left join keeps every row from the left table and shows null values when a related row is absent.
Exception-oriented queries deliberately search for missing relationships: shipments without invoices, purchase orders without receipts, employees without approved time, or journal entries without preparer information. The absence of a record becomes the evidence under investigation.
Null requires careful interpretation. It can mean not applicable, unknown, not yet recorded, or lost during an interface. The query identifies the condition; process knowledge determines what the condition means and whether it is acceptable.
Figure 4.5 · Exception logic with joins
Missing matches can be the most important rows
01Order + shipmentFulfilled order; continue to billing review
02Order onlyOpen, canceled, delayed, or unfulfilled
03Shipment + invoiceBilled shipment; test cutoff and amount
04Shipment onlyPotential unbilled shipment or interface failure
Outer joins preserve unmatched records so the accountant can distinguish expected gaps from processing failures.
Illustrative SQL
SELECT s.shipment_id, s.order_id, s.ship_date
FROM shipments AS s
LEFT JOIN invoices AS i
  ON i.order_id = s.order_id
WHERE i.invoice_id IS NULL;
4.6
Controls over analytical SQL
A query used for a key report or control should be treated as controlled logic. Document its purpose, owner, data sources, parameters, expected grain, and reconciliation. Restrict changes, review code, test edge cases, and retain the version used for important decisions. A saved query name is not sufficient documentation if the underlying logic can change without evidence.
Completeness and accuracy depend on more than syntax. The source extract may be incomplete, the join may omit records, the filter may use the wrong date, or the user may run the query against a test environment. Useful output identifies the as-of date, source, parameters, and run time so another person can understand what was produced.
Source figure · SQL statement anatomy
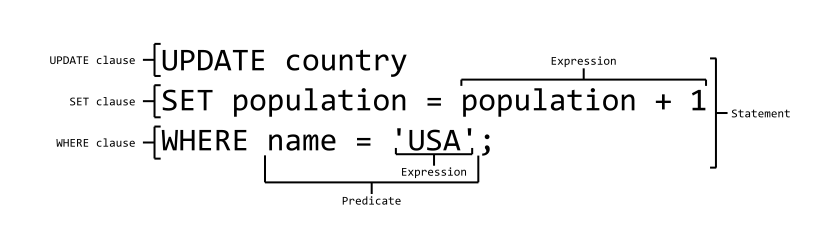
SQL can change records as well as read them
Earlier examples use SELECT to read data. This UPDATE statement shows why production access deserves stricter control: a short command can change an entire population unless its predicate is correct. Accountants should distinguish read-only analysis from data-changing commands and require authorization, testing, logging, and recovery for the latter.Image credit: Ferdna. Source: Wikimedia Commons. Reuse terms: CC BY-SA 3.0.
Figure 4.6 · Controlled analytical query
A useful query remains traceable from specification through result
01SpecifyPurpose, population, grain, date, and owner
02DevelopWrite joins, filters, calculations, and parameters
03TestUse known cases, edge cases, counts, and totals
04Approve and runControl the version, source, environment, and changes
05ReconcileTrace exceptions and compare with independent evidence
Review and reconciliation matter because correct syntax cannot detect an incomplete source, wrong environment, or incorrect accounting definition.Check your understandingA query returns the expected total. What additional validation is still useful?
Inspect row-level results, reconcile record counts, test known exceptions, confirm the source and date parameters, review joins and filters, and verify that the total was not reached through offsetting errors.
Worked case
Find June shipments that were not billed by period end
The controller wants one row per shipment through June 30 that lacks a valid customer invoice as of the same date. Warranty replacements should remain visible but labeled, not silently removed.
Define the grain and population
One row represents one shipment. Begin with completed shipments dated on or before June 30. Include identifiers, customer, order, shipment date, quantity, amount basis, billable status, and reason codes.
Choose the driving table
Start FROM Shipment because completeness is measured from events that may require billing. Beginning with Invoice could never reveal a shipment that has no invoice row.
Preserve missing matches
LEFT JOIN Invoice using the true business relationship, such as ShipmentID, while placing invoice validity and cutoff conditions in the join logic when necessary. Then select rows where the matched invoice identifier IS NULL.
Control one-to-many relationships
Determine whether one shipment can have several invoices or credits. If yes, joining raw rows may multiply shipments. Aggregate valid billing by ShipmentID or define a controlled status before selecting exceptions.
Validate the result
Reconcile total eligible shipments to billed and unbilled populations, inspect known warranty and cutoff cases, verify source system and as-of date, and trace each exception to shipping and billing evidence.
What the case establishes
The query is reliable because its starting population matches the completeness objective, unmatched rows remain visible, and the result is reconciled to independently expected shipments.
Common misconceptions
Ideas that sound plausible—but need correction
“A query that runs without errors is correct.”
The syntax may be valid while the population, date, join, grain, or accounting definition is wrong. Business validation is separate from execution.
“A join simply adds columns.”
A join constructs rows. One-to-many relationships can multiply a source row, while missing or mismatched keys can omit it under an inner join.
“DISTINCT fixes duplicate rows.”
DISTINCT removes exact duplicate output rows. It can hide symptoms without correcting a wrong relationship or output grain and may leave duplicated amounts.
“NULL equals zero.”
Zero is a known numeric value. NULL indicates missing or inapplicable information and behaves differently in comparisons and calculations.
Mastery practice
Work the problem before opening the solution
Write the accounting question, population, and output grain before writing SQL. For every query, predict row counts and reconcile monetary totals to a trusted source.
Problem 1Foundation
Choose the correct output grain
output grain
SELECT
accounting question
Scenario
Tables include Invoice(InvoiceID, CustomerID, InvoiceDate), InvoiceLine(InvoiceID, LineNo, ProductID, Quantity, LineAmount), and Customer(CustomerID, CustomerName, Region). The controller asks for total invoiced sales by customer and month.
Your work
State the output grain and required tables.
Write a query that produces the requested result.
Describe two totals or counts you would use to validate it.
Need a starting hint?
The amount is stored at invoice-line grain, but the requested output is customer-month grain.
Reveal the worked solution
The output is one row per customer per invoice month. InvoiceLine supplies amount, Invoice supplies date and customer, and Customer supplies the readable name.
Validate total LineAmount before and after grouping for the same population, and compare distinct invoice counts and line counts with trusted source totals. Also inspect a few customers across month boundaries.
One defensible SQL solution
SELECT
  i.CustomerID,
  c.CustomerName,
  DATE_TRUNC('month', i.InvoiceDate) AS InvoiceMonth,
  SUM(il.LineAmount) AS InvoicedSales
FROM Invoice AS i
JOIN InvoiceLine AS il
  ON il.InvoiceID = i.InvoiceID
JOIN Customer AS c
  ON c.CustomerID = i.CustomerID
GROUP BY
  i.CustomerID,
  c.CustomerName,
  DATE_TRUNC('month', i.InvoiceDate);
Problem 2Applied
Find invoices with no cash application
LEFT JOIN
null
completeness
Scenario
Invoice has one row per invoice. CashApplication has one row per application and can contain several applications for one invoice. The credit manager wants invoices dated before June 30 that have no application at all.
Your work
Explain why an inner join cannot answer the question.
Write the query using an outer join.
Explain how the answer differs from invoices with an unpaid balance.
Need a starting hint?
Preserve all invoices, then keep the rows for which the child-side key is absent.
Reveal the worked solution
An inner join removes invoices that have no matching application—the exact population of interest.
The query tests for a missing application key after preserving invoices with LEFT JOIN.
No application means zero application records. An unpaid balance can include invoices with partial applications, credits, write-offs, or adjustments, so it requires amount logic rather than existence logic alone.
One defensible SQL solution
SELECT
  i.InvoiceID,
  i.CustomerID,
  i.InvoiceDate,
  i.InvoiceAmount
FROM Invoice AS i
LEFT JOIN CashApplication AS ca
  ON ca.InvoiceID = i.InvoiceID
WHERE i.InvoiceDate < DATE '2026-06-30'
  AND ca.CashApplicationID IS NULL;
Problem 3Applied
Use WHERE and HAVING correctly
WHERE
GROUP BY
HAVING
Scenario
The audit team wants vendors with more than $250,000 of approved payments during 2026, excluding voided payments before aggregation.
Your work
Write the query and distinguish the roles of WHERE and HAVING.
Explain what would go wrong if the voided-payment condition appeared only in HAVING.
Propose a drill-down query or field that would help investigate the result.
Need a starting hint?
WHERE determines which detail rows enter the groups; HAVING determines which completed groups remain.
Reveal the worked solution
Filter year, approved status, and non-voided detail rows in WHERE. Group the remaining rows by vendor, then use HAVING on the aggregate.
A group-level condition cannot cleanly remove individual voided rows before SUM. Including them can inflate vendor totals or produce invalid SQL depending on the expression.
Investigators should be able to drill to PaymentID, date, invoice, amount, approver, bank account, and any vendor-master changes so that an aggregate flag leads back to evidence.
One defensible SQL solution
SELECT
  p.VendorID,
  SUM(p.PaymentAmount) AS ApprovedPayments
FROM Payment AS p
WHERE p.PaymentDate >= DATE '2026-01-01'
  AND p.PaymentDate < DATE '2027-01-01'
  AND p.Status = 'Approved'
  AND p.IsVoided = FALSE
GROUP BY p.VendorID
HAVING SUM(p.PaymentAmount) > 250000;
Problem 4Challenge
Repair a duplicate-producing join
join cardinality
pre-aggregation
reconciliation
Scenario
An Invoice table contains InvoiceAmount. A CashApplication table contains several applications per invoice. A Dispute table can contain several dispute updates per invoice. A query joins all three on InvoiceID and reports invoice amount, total applied cash, and number of disputes. Totals are overstated.
Your work
Explain the multiplicative row problem.
Write a safe query that returns one row per invoice.
Explain why SELECT DISTINCT is not a reliable correction.
Need a starting hint?
Aggregate each one-to-many child table to invoice grain before joining the child results to Invoice.
Reveal the worked solution
If an invoice has two applications and three dispute rows, joining both detail tables produces six rows. Application amounts repeat for every dispute, and disputes repeat for every application.
The safe design creates one application summary and one dispute summary per invoice, then joins each summary to the invoice parent.
DISTINCT removes identical rows, not invalid multiplicity. Different application amounts and dispute timestamps remain distinct, while legitimately repeated values can be incorrectly collapsed.
One defensible SQL solution
WITH application_summary AS (
  SELECT InvoiceID, SUM(AppliedAmount) AS TotalApplied
  FROM CashApplication
  GROUP BY InvoiceID
),
dispute_summary AS (
  SELECT InvoiceID, COUNT(*) AS DisputeUpdates
  FROM Dispute
  GROUP BY InvoiceID
)
SELECT
  i.InvoiceID,
  i.InvoiceAmount,
  COALESCE(a.TotalApplied, 0) AS TotalApplied,
  COALESCE(d.DisputeUpdates, 0) AS DisputeUpdates
FROM Invoice AS i
LEFT JOIN application_summary AS a
  ON a.InvoiceID = i.InvoiceID
LEFT JOIN dispute_summary AS d
  ON d.InvoiceID = i.InvoiceID;
Problem 5Challenge
Test for duplicate payments without double-counting
self-join
matching rules
false positives
Scenario
Payment(PaymentID, VendorID, InvoiceNumber, PaymentDate, Amount, Status) may contain duplicate payments. The team defines a candidate pair as the same vendor, normalized invoice number, and amount, with different payment IDs and neither payment voided.
Your work
Write a self-join that returns each candidate pair only once.
Explain why matching on amount alone is weak and why invoice-number normalization matters.
List evidence needed before classifying a candidate as an actual duplicate.
Need a starting hint?
Use an inequality such as p1.PaymentID < p2.PaymentID to prevent both A–B and B–A pairs.
Reveal the worked solution
The ID inequality prevents mirrored and self-pairs. Vendor, normalized invoice number, and amount form the candidate rule; status conditions remove voids.
Many legitimate payments share an amount. Invoice values may differ only because of spaces, punctuation, or case, so a controlled normalized field improves matching while the original value remains available for evidence.
Review original invoices, purchase orders, receipts, payment approvals, bank clearing, credits, split-payment terms, reversal history, and vendor correspondence. A candidate query is a detection procedure, not a final fraud or error conclusion.
One defensible SQL solution
SELECT
  p1.PaymentID AS PaymentA,
  p2.PaymentID AS PaymentB,
  p1.VendorID,
  p1.InvoiceNumber,
  p1.Amount
FROM Payment AS p1
JOIN Payment AS p2
  ON p1.VendorID = p2.VendorID
 AND UPPER(REPLACE(p1.InvoiceNumber, ' ', '')) =
     UPPER(REPLACE(p2.InvoiceNumber, ' ', ''))
 AND p1.Amount = p2.Amount
 AND p1.PaymentID < p2.PaymentID
WHERE p1.Status <> 'Voided'
  AND p2.Status <> 'Voided';
Problem 6Applied
Prove query completeness before relying on exceptions
population validation
reconciliation
audit evidence
Scenario
A query identifies 37 sales invoices posted before shipment. Management wants to correct them immediately, but the analyst has not documented how the source extract relates to the general ledger.
Your work
Specify population-level validation procedures before investigating the 37 exceptions.
Describe record-level validation for a sample of exceptions and non-exceptions.
Explain why accurate exception logic applied to an incomplete population is still unreliable.
Need a starting hint?
Validate the universe first: period, entities, status, row counts, distinct keys, and monetary control totals.
Reveal the worked solution
Reconcile invoice count and amount by period and entity to the sales subledger and general ledger; document extraction time, filters, status logic, joins, nulls, duplicates, and excluded records; confirm unique invoice keys and shipment coverage.
For exception samples, inspect invoice, order, shipment, terms, timestamps, and posting records. For non-exception samples, verify that the query did not miss late or absent shipments. Reperform date logic and investigate timezone or correction records.
Completeness is a prerequisite for a negative conclusion. Missing subsidiaries, statuses, or records can make the 37 flags correct yet materially incomplete, which would understate the control failure and misdirect correction work.
Chapter review
Explain before revealing
Answer each question in your own words. Then open the explanation and compare the logic, not just the vocabulary.
01Why must grain be defined before a query is written?
Grain determines which tables, joins, identifiers, grouping, and calculations are valid and prevents totals from being interpreted at the wrong level.
02When is a left join preferable to an inner join?
When unmatched rows from the driving population are meaningful, such as shipments without invoices or vendors without activity, and must remain visible.
03Why can a correct total still be insufficient validation?
Duplicates and omissions may offset, classifications can be wrong, or the correct amount may come from the wrong rows. Counts, identifiers, known cases, and traceability are also needed.
Chapter 5
Part III · Processes and control
Risk, fraud, cybersecurity, and internal control
Controls reduce the likelihood or impact of unacceptable outcomes; they do not make risk disappear.
After this chapter, you should be able to
Distinguish threats, vulnerabilities, events, impacts, and responses.
Explain preventive, detective, corrective, and recovery controls.
Connect fraud risks to opportunity, incentives, rationalization, and evidence.
Differentiate IT general controls from application controls.
Chapter roadmap
Start with the question, then build the concept
The essential question
How do we connect a specific risk to a control that can actually be operated and tested?
Control language is useful only when it identifies the objective, threat, vulnerability, event, consequence, owner, timing, evidence, and response. Vague statements such as management reviews reports cannot support reliable operations or audit testing.
Before you begin
Distinguish a business objective from something that could prevent the objective.
Recall the differences among authorization, custody, recording, and reconciliation.
Recognize that controls reduce risk but do not guarantee a perfect outcome.
A productive reading sequence
Write a concrete risk scenario using threat, vulnerability, event, and impact.
Choose preventive, detective, corrective, and recovery controls at different points in the scenario.
Connect fraud opportunity and cybersecurity objectives to access, change, and transaction controls.
Document who performs each control, when, with which evidence, and what happens to exceptions.
Concepts to hold onto
Threat and vulnerability
A threat is a potential source of harm; a vulnerability is a weakness that allows the threat to create an adverse event.
Preventive and detective control
A preventive control attempts to stop an unacceptable event. A detective control identifies an event or condition after or as it occurs.
IT general control
A control over the technology environment, including access, changes, operations, backup, and recovery, on which application controls rely.
Application control
A configured or programmed control over particular transactions, such as input validation, matching, calculation, limit, or workflow approval.
Residual risk
The risk that remains after considering the design and operation of responses and controls.
5.1
A disciplined language for risk
A threat is a potential source of harm, such as a dishonest employee, phishing campaign, fire, or software defect. A vulnerability is a weakness that a threat can exploit, such as shared credentials, unpatched software, or an unverified change process. A risk event is the occurrence itself. Impact is the consequence to operations, reporting, compliance, assets, or reputation.
Separating these ideas improves control design. Saying cyber risk is too broad to guide action. Saying a phished accounts-payable employee could expose credentials that allow an attacker to change vendor bank data and redirect payments identifies the actor, weakness, event, and consequence. The organization can then choose controls at several points in the chain.
Risk assessment considers likelihood and impact, but the numbers are estimates rather than facts. Low-frequency events may deserve strong controls when the potential loss is catastrophic. Management also considers velocity, persistence, detectability, and interdependence with other risks.
5.2
Prevent, detect, correct, and recover
Preventive controls attempt to stop an unacceptable event before it occurs. Segregation of duties, approvals, access restrictions, and input validation are examples. Detective controls identify events that occurred or conditions that may indicate a problem. Reconciliations, exception reports, log monitoring, and physical counts are common examples.
Corrective controls repair identified errors or weaknesses, while recovery controls restore operations and data after disruption. The categories can overlap. A backup supports recovery, but testing the restore process is a detective control over whether the backup actually works. A control portfolio is stronger when it does not depend on one mechanism or one person.
Control design should specify the risk, control owner, frequency or trigger, evidence, investigation method, and escalation path. “Management reviews reports” is not a complete control description. Which report, for what, using what criteria, and what happens when the reviewer finds an exception?
Figure 5.1 · Risk-to-control logic
Controls should interrupt a stated path from threat to consequence
01ObjectiveWhat must go right?
02ThreatWhat could prevent it?
03Control activityWho prevents or detects the failure?
04EvidenceWhat proves the control operated?
A control is persuasive only when its owner, timing, evidence, and response are specific enough to test.
5.3
Fraud changes the control problem
Error is unintentional; fraud involves intentional deception. Both can misstate records, but fraud is harder to control because the actor may understand and circumvent normal procedures. Collusion can defeat segregation of duties, and managers may override controls designed for subordinates.
The fraud triangle describes pressure or incentive, opportunity, and rationalization. It is not a formula that predicts a dishonest person. For system design, opportunity is especially actionable. Excessive access, weak review, opaque estimates, missing audit logs, and a culture that rewards results without questioning methods can increase opportunity.
Fraud detection requires skepticism about patterns and explanations. A valid approval does not prove the approver was independent. A three-way match does not protect a fictitious vendor if one employee created the vendor, purchase order, and receipt. Controls should consider how records could be made to agree falsely.
Source figure · Fraud triangle
Fraud risk is often examined through pressure, opportunity, and rationalization
The triangle is a way to organize questions, not a formula that proves intent. AIS controls most directly reduce opportunity through authorization, access restriction, segregation, monitoring, and evidence. Pressure and rationalization still matter when managers investigate incentives, culture, override, and patterns of behavior.Image credit: DavidBailey. Source: Wikimedia Commons. Reuse terms: CC BY-SA 4.0.
Figure 5.2 · Fraud conditions and response
Fraud risk grows when pressure, opportunity, and rationalization reinforce one another
01PressureFinancial, performance, or personal incentive
02OpportunityAccess, weak oversight, or override ability
03RationalizationA story that makes the act feel acceptable
04ConcealmentFalse records, collusion, or suppression
05Detection and responseEvidence, investigation, correction, and consequence
Controls most directly reduce opportunity, while culture, incentives, reporting channels, and consequences affect the broader environment.
5.4
Confidentiality, integrity, and availability
Confidentiality means information is accessible only to authorized parties. Integrity means data and processing are complete, accurate, authorized, and protected from improper change. Availability means systems and information are accessible when needed. AIS security decisions often involve all three.
Encryption can protect confidentiality in transit or storage, but it does not prove that the sender was authorized to change a vendor. A digital signature can support origin and integrity, but it does not make false content true. Backups support availability and recovery, but they are useful only if protected, current, and restorable.
Least privilege gives users only the access needed for their responsibilities. Access should be approved, periodically reviewed, and removed promptly when roles change. Privileged accounts deserve additional monitoring because they can alter configurations, users, and logs.
Source figure · NIST Cybersecurity Framework 2.0
Cybersecurity risk management connects six functions
The wheel emphasizes that cybersecurity is an ongoing management system. Govern informs Identify, Protect, Detect, Respond, and Recover rather than operating as a one-time compliance step.Image credit: NIST / Natasha Hanacek. Source: National Institute of Standards and Technology. Reuse terms: NIST-created U.S. government work.
Security objective and accounting example
Objective
Example failure
Illustrative control
Confidentiality
Payroll data exposed to unauthorized staff
Role-based access and monitored exports
Integrity
Payment file changed after approval
File signing, restricted transfer, and bank confirmation totals
Availability
ERP unavailable during close
Resilient infrastructure, tested recovery, and manual contingencies
5.5
IT general controls and application controls
IT general controls support the environment in which applications operate. Major areas include access management, program change, computer operations, backup and recovery, and system development. Application controls operate within a particular process or program, such as a credit-limit check, duplicate-invoice test, three-way match, or automated account mapping.
The distinction matters because a perfectly configured application control can become unreliable if administrators can change its logic without approval or if access allows users to bypass it. Conversely, strong general controls do not guarantee that a particular business rule is designed correctly.
Automated controls can be consistent and efficient, but their reliability depends on configuration, input data, interfaces, and the general control environment. Testing often includes understanding the rule, testing relevant configurations and access, evaluating changes, and verifying that the control operated on a complete population.
Figure 5.3 · Two control layers
Application controls depend on a reliable technology environment
01IT general controlsAccess, change management, operations, backup, and recovery
02FoundationKeep applications and configurations trustworthy over time
03Application controlsInput validation, matching, limits, calculations, and workflow
04Transaction resultAuthorized, complete, accurate, and timely processing
A configured three-way match is less persuasive if unauthorized developers can change the rule or production data.
5.6
Third parties do not transfer accountability
Cloud providers, payroll processors, payment platforms, and other service organizations may perform important AIS activities. Outsourcing changes who operates the control; it does not remove management’s responsibility for its process, financial statements, compliance, or customer commitments.
Management should understand the service scope, access model, data location, incident responsibilities, recovery commitments, and controls that the customer must perform. Independent assurance reports can provide useful evidence about the provider, but they must be read for period, scope, exceptions, subservice organizations, and complementary user-entity controls.
A provider may calculate payroll accurately while the customer remains responsible for approved employee data. If Northstar fails to remove terminated employees, a clean report over the processor does not correct Northstar’s input failure.
Check your understandingWhat is a complementary user-entity control?
It is a control the service organization assumes the customer will perform for the overall control objective to be achieved—for example, approving payroll changes before sending employee data to the processor.
Worked case
Control a fraudulent vendor-bank change
An attacker impersonates a vendor and emails an accounts-payable employee requesting new bank details. The employee can edit vendor master data, and the next payment run contains $480,000 of genuine approved invoices for that vendor.
State the risk scenario
A social-engineering attacker could exploit weak change verification and excessive access to alter vendor bank data, causing authorized invoices to be paid to an unauthorized account and creating cash loss and reporting error.
Place preventive controls
Restrict vendor-master access, require phishing-resistant authentication, separate request from approval, verify changes through an independently obtained contact, validate account ownership, and delay high-risk changes before payment.
Add detective controls
Produce a complete vendor-change report showing old and new values, requester, approver, time, verification evidence, upcoming payments, and unusual patterns. Have an independent owner review before the payment run.
Define response and evidence
Unverified changes are placed on payment hold. Confirmed incidents trigger bank contact, access containment, payment recall, affected-record review, notification, root-cause analysis, and correction. Retain verification and review evidence.
Test dependencies
Application workflow is not reliable if administrators can bypass approval, developers can change rules without review, or logs can be altered. IT general controls support the application control's continued operation.
What the case establishes
Invoice approval alone does not address payment redirection. The control design must focus on the master-data change that determines where legitimate invoices are paid.
Common misconceptions
Ideas that sound plausible—but need correction
“More controls always mean lower risk.”
Redundant or poorly designed controls can create noise, delay, and false assurance. Controls should address stated risks and produce usable evidence.
“Human review is automatically a strong control.”
Strength depends on reviewer competence, independence, criteria, information, workload, authority, documentation, and follow-up.
“Cybersecurity is separate from accounting.”
Unauthorized access, altered programs, unavailable systems, and compromised master data directly affect transactions, evidence, reporting, and assets.
Mastery practice
Work the problem before opening the solution
Do not recommend a control until you have stated the risk event, affected objective or assertion, likely cause, and evidence that would show whether the control operated.
Problem 1Applied
Build a risk-and-control matrix for vendor changes
risk statements
control design
evidence
Scenario
Accounts-payable clerks can edit vendor addresses and bank accounts. A nightly report lists changes, but it is sent to the AP manager who can also make changes. The report contains vendor ID, old value, new value, user, and time; it does not show payments made after the change.
Your work
Write two precise risk statements using cause, event, and consequence.
Assess the preventive and detective control gaps.
Design a control set and identify the evidence needed to test each control.
Need a starting hint?
A control is stronger when the reviewer is independent, the population is complete, the review criteria are specific, and exceptions are resolved before money moves.
Reveal the worked solution
One risk is that a clerk with excessive access changes a legitimate vendor's bank account, causing an authorized invoice to be paid to an unauthorized account. Another is that a mistaken bank change is not detected before payment, causing loss, recovery cost, and misstated cash or payable records.
There is no independent approval or out-of-band verification before a sensitive change becomes effective. The report reviewer lacks independence, and the report does not prioritize changes followed quickly by payments or prove that the change population is complete.
Use role-based access, maker-checker approval, independent callback using previously validated contact information, effective-date controls, and a temporary payment hold. Send a complete change report plus post-change payment linkage to an independent reviewer. Evidence includes access listings, change request, callback record, approval, old/new values, report-control totals, reviewer signoff, exception resolution, and release of any hold.
Problem 2Challenge
Analyze a vendor-fraud scenario without jumping to conclusions
fraud triangle
red flags
investigation design
Scenario
A purchasing manager repeatedly awards small contracts to a new vendor just below the $25,000 competitive-bid threshold. The vendor shares a mailing address with the manager's sibling. Deliveries exist, prices are 18% above comparable items, and the manager says the supplier is more reliable.
Your work
Identify incentives or pressures, opportunities, rationalizations, and observable red flags while distinguishing evidence from inference.
Propose a fair investigation plan that tests both misconduct and legitimate explanations.
Recommend controls that address the process even if fraud is not proven.
Need a starting hint?
A red flag changes the need for investigation; it is not itself a conclusion about intent.
Reveal the worked solution
Opportunity may arise from the manager's authority and threshold design. The related address, repeated just-below-threshold awards, concentration, and price premium are red flags. Pressure and rationalization are unknown; reliability is a potentially legitimate explanation that must be tested.
Preserve records, validate beneficial ownership and conflicts, compare bids and total cost, inspect receipt and quality evidence, analyze split purchases and approvals, interview appropriate parties under policy, and involve legal, HR, compliance, or internal audit as required. Protect confidentiality and avoid labeling the manager before evidence is assessed.
Require conflict disclosures, aggregate related purchases for threshold purposes, rotate or independently review sourcing, monitor threshold clustering and vendor concentration, document exceptions, verify ownership for higher-risk vendors, and review price and performance together.
Problem 3Applied
Resolve segregation-of-duties conflicts
segregation of duties
least privilege
compensating controls
Scenario
At a small division, one senior accountant can create vendors, enter invoices, release payment batches, and reconcile the bank. Management says staffing makes full separation impossible.
Your work
Identify the incompatible duties and describe a plausible error or fraud path.
Prioritize which access should be removed first.
Design compensating controls and explain their limitations.
Need a starting hint?
Authorization, custody, recording, and reconciliation should not all reside with the same person. When staffing is limited, move a critical approval or review outside the process.
Reveal the worked solution
The accountant can create a payee, record an obligation, initiate release of cash, and conceal the result during reconciliation. The combination permits both execution and cover-up.
At minimum, remove payment release and vendor-master approval from the accountant. Those points control who can receive cash and whether cash leaves. Access should follow documented job need rather than seniority.
An independent manager can approve vendor changes and payment release using source evidence; the owner or central treasury can review bank-positive-pay exceptions; someone outside AP can review reconciliations and unmatched items; change and payment analytics can flag risky combinations. Compensating controls are weaker if the reviewer lacks time, evidence, criteria, or system access, so their operation must be documented and periodically tested.
Problem 4Challenge
Respond to a compromised accounting account
cybersecurity
incident response
financial consequences
Scenario
A controller approves a fake multifactor-authentication prompt. An attacker enters the ERP, downloads customer data, creates an API token, and attempts two journal entries before security disables the account four hours later.
Your work
Identify confidentiality, integrity, availability, privacy, and financial-reporting concerns.
Sequence immediate containment, investigation, recovery, and communication actions.
Identify accounting evidence needed to determine whether financial records were altered.
Need a starting hint?
Disabling one user session is not enough if the attacker created persistent credentials or used connected systems.
Reveal the worked solution
Customer data exposure affects confidentiality and privacy. Attempted journal entries threaten integrity and financial reporting. Containment actions may disrupt availability. The API token creates persistence and may expand the affected system boundary.
Disable sessions and credentials, revoke tokens, preserve logs, isolate affected integrations, reset credentials through trusted channels, assess scope, examine data access and changes, restore only after validation, notify internal response owners, and follow legal, contractual, regulatory, insurer, customer, and governance obligations based on confirmed facts.
Reconcile journal-entry logs, workflow approvals, account and role changes, master-data changes, interfaces, exports, and general-ledger balances for the affected period. Inspect attempted and successful entries, reversals, timestamps, source IPs, supporting documents, and downstream reports. Retain a defensible incident timeline.
Problem 5Applied
Evaluate an emergency production change
IT general controls
change management
reperformance
Scenario
On the final day of the quarter, a developer changes the revenue-posting rule directly in production to fix a cutoff defect. The code works on three examples. No ticket, peer review, test evidence, or backout plan exists.
Your work
Explain why a necessary fix can still create a control deficiency.
Design an emergency-change process proportionate to the urgency.
Describe retrospective testing needed for the quarter-end records.
Need a starting hint?
Emergency procedures can be faster, but they should not erase authorization, testing, traceability, or review.
Reveal the worked solution
The fix may correct one cutoff condition while introducing untested logic, unauthorized behavior, inconsistent environments, or no way to prove what changed. Three selected examples do not establish completeness across transaction types and edge cases.
Require an incident ticket, documented risk and scope, authorized emergency approval, preserved code difference, focused tests including failure and boundary cases, independent review as soon as feasible, deployment logging, monitoring, and a backout plan. Separate developer access should be time-limited and logged.
Identify all transactions processed under old and new rules, test the population around cutoff, reconcile postings to shipments and source evidence, compare expected and actual results, inspect exceptions and reversals, and have an independent accounting owner conclude on correction and disclosure needs.
Problem 6Challenge
Use a service-auditor report correctly
service organizations
assurance scope
user controls
Scenario
Northstar outsources payroll processing. The provider supplies a current SOC 1 Type 2 report with an unmodified opinion. Management concludes that no internal payroll controls need testing.
Your work
Assess management's conclusion.
List scope and exception questions to ask when reading the report.
Give examples of complementary user-entity controls Northstar may still need.
Need a starting hint?
The provider's controls do not determine who Northstar hires, what data Northstar submits, or whether Northstar reviews the output.
Reveal the worked solution
The conclusion is incorrect. The report covers specified provider controls, objectives, systems, locations, subservice organizations, and a period. Northstar retains responsibility for its inputs, access, decisions, complementary controls, and the gap between the report period and year-end.
Inspect covered services and assertions, report period, system boundary, control objectives, tests and exceptions, subservice carve-outs, complementary user controls, changes after the period, and whether the opinion and auditor are appropriate for reliance.
Northstar may need controls over authorized employee master data, approved time and pay rates, access, complete and accurate files sent to the provider, reconciliation of payroll output and cash, review of exception reports, tax filings, terminated users, and period-end changes. These controls require Northstar evidence even when provider controls operate effectively.
Chapter review
Explain before revealing
Answer each question in your own words. Then open the explanation and compare the logic, not just the vocabulary.
01What makes a control description testable?
It identifies the risk, owner, activity, population, frequency or trigger, criteria, evidence, exception handling, and escalation.
02Why should a control portfolio include different control types?
No single control is perfect. Prevention reduces occurrence, detection identifies failures, correction repairs records or weaknesses, and recovery restores service or data.
03How can segregation of duties fail in an automated system?
One role may combine incompatible permissions, an administrator may override workflow, shared credentials may hide identity, or collusion may bypass separated roles.
Chapter 6
Part III · Processes and control
Revenue and expenditure cycles
Business cycles connect economic exchanges to documents, responsibilities, accounting entries, and control evidence.
After this chapter, you should be able to
Trace the order-to-cash and procure-to-pay processes.
Match process risks with controls and evidence.
Apply segregation of duties to authorization, custody, recording, and reconciliation.
Connect process failures to financial-statement assertions.
Chapter roadmap
Start with the question, then build the concept
The essential question
How do documents, records, controls, and accounting consequences connect across the sell-to-collect and purchase-to-pay processes?
Financial-statement balances are compressed results of operational cycles. Understanding the sequence helps accountants identify missing events, incorrect timing, duplicate processing, unauthorized activity, and weak evidence.
Before you begin
Distinguish orders, shipments or receipts, invoices, receivables or payables, and cash movements.
Recall occurrence, completeness, accuracy, cutoff, rights and obligations, and classification assertions.
Understand authorization, custody, recording, and reconciliation responsibilities.
A productive reading sequence
Follow revenue from customer order through shipment, billing, collection, and returns.
Follow expenditure from requisition through order, receipt, invoice, liability, and payment.
Use matching and segregation to connect authorization, custody, price, quantity, and settlement evidence.
Link each process risk to financial-statement assertions and exception analysis.
Concepts to hold onto
Three-way match
Comparison of purchase order, receiving evidence, and vendor invoice to validate authorization, quantity, price, and the obligation before payment.
Segregation of duties
Separation of incompatible authorization, custody, recording, and review responsibilities so one person cannot both commit and conceal an error or fraud.
Cutoff
Recording an event in the correct accounting period based on the event that satisfies the recognition rule, not merely document creation or entry date.
Process mining
Analysis of timestamped event logs to reconstruct actual process paths, durations, repetitions, deviations, and control bypasses.
6.1
Think in cycles, not isolated entries
A transaction cycle groups recurring activities that accomplish a business purpose. The revenue cycle converts customer demand into delivery and collection. The expenditure cycle converts organizational needs into acquired goods or services and payment. Each cycle crosses departments, systems, and accounting records.
Cycle thinking helps accountants understand cause and evidence. Accounts receivable is not created by the general ledger team; it emerges from customer setup, order acceptance, fulfillment, billing, and posting. Accounts payable depends on need identification, vendor selection, ordering, receipt, invoice processing, and payment. An error near the beginning can flow through every later record.
A useful process analysis identifies activities, actors, documents, data, decisions, risks, controls, and accounting effects. Flowcharts are valuable when they make handoffs and responsibilities visible rather than merely decorating a list of steps.
Figure 6.1 · Two connected cycles
Revenue and expenditure move evidence in opposite directions
Revenue converts goods or services into receivables and cash; expenditure converts purchasing commitments into goods, liabilities, and payments.
6.2
Order to cash
The revenue cycle commonly includes customer setup, sales-order entry, credit approval, inventory allocation, picking, shipping, billing, accounts-receivable maintenance, cash collection, and returns. Organizations combine or automate activities differently, but the economic sequence remains useful.
Important risks include accepting orders from invalid or poor-credit customers, using unauthorized prices, shipping the wrong goods, recording fictitious or premature revenue, failing to bill shipments, misapplying cash, and concealing theft through write-offs. The strongest controls are positioned where they can prevent or expose the specific failure.
The system should retain status transitions. An order might be entered, approved, partially shipped, backordered, billed, disputed, returned, and closed. Replacing status history with only the current status weakens cutoff analysis and makes it harder to explain exceptions.
Figure 6.2 · Revenue cycle evidence
Revenue is supported by a sequence, not merely an invoice
Customer authorization, fulfillment, billing, and collection are distinct events that should remain linked.
Revenue-cycle activity, evidence, and risk
Activity
Key evidence
Illustrative risk
Accept order
Sales order and credit decision
Unauthorized price or credit override
Ship goods
Pick record and carrier evidence
Wrong quantity or fictitious shipment
Bill customer
Invoice linked to shipment
Unbilled shipment or duplicate invoice
Collect cash
Bank record and remittance advice
Misappropriation or misapplication
Process return
Return authorization and receipt
False credit or inventory not received
6.3
Procure to pay
The expenditure cycle usually begins with a need. An authorized requisition leads to vendor selection and a purchase order. Receiving records what arrived. Accounts payable evaluates the vendor invoice against authorized terms and receipt evidence. Treasury or another authorized function releases payment, and accounting records the liability and cash effect.
A three-way match compares the purchase order, receiving record, and vendor invoice. It addresses whether the organization ordered the goods, received them, and was billed consistently. Tolerances may permit small differences, but tolerance design should reflect risk, materiality, and the possibility of transaction splitting.
Not all purchases fit a physical-goods process. Utilities, rent, professional services, subscriptions, and recurring charges may lack a receiving document. The organization needs alternative evidence, such as a contract owner’s service confirmation, usage record, milestone approval, or controlled recurring-payment schedule.
Source figure · Procure-to-pay process
One purchase becomes several related records before cash leaves
Use the process stages to identify the evidence created at each point. The purchase order establishes authorization, receipt records what arrived, the supplier invoice establishes the claim, and payment settles it. A three-way match works because the records represent different events rather than duplicate copies of one fact.Image credit: Soobrast. Source: Wikimedia Commons. Reuse terms: CC BY-SA 4.0.
6.4
Segregation of duties
Segregation of duties separates incompatible responsibilities so that one person cannot both commit and conceal an error or fraud. The classic categories are authorization, custody of assets, recording, and independent reconciliation. In digital systems, configuration and privileged access can also create powerful combinations.
Perfect separation is not always possible, especially in smaller organizations. Management can add compensating controls such as detailed owner review, bank alerts, restricted transaction limits, independent reconciliations, or external support. The compensating control must address the actual combination of access rather than merely add another signature.
Role design should consider what users can accomplish across applications. An employee may lack payment approval in the ERP but have access to change vendor data and release files on the banking platform. Reviewing each system separately can miss the combined capability.
Figure 6.3 · Segregation of duties
Separate authority, custody, recording, and review
01AuthorizeApprove the transaction or change
02CustodyControl cash, inventory, or other assets
03RecordCreate or modify the accounting record
04ReconcileCompare records with independent evidence
The objective is to prevent one person from completing and concealing an incompatible combination of actions.
6.5
From process failure to financial-statement assertion
Financial-statement assertions translate broad reporting risk into testable claims. Existence or occurrence asks whether recorded assets, liabilities, and transactions are real. Completeness asks whether required items were recorded. Rights and obligations considers ownership and responsibility. Valuation and allocation considers appropriate amounts. Cutoff considers the correct period. Presentation and disclosure considers classification and explanation.
The same process supports several assertions through different controls. Prenumbered shipping documents and investigation of sequence gaps can support completeness. Matching invoices to shipping evidence can support occurrence. Comparing dates can support cutoff. Reviewing prices, quantities, returns, and collectibility can support accuracy and valuation.
Avoid matching one control mechanically to one assertion. Start with how the process could produce a misstatement, then evaluate whether the control prevents or detects that path with sufficient precision.
Check your understandingWhich population is strongest for testing whether all shipments were billed?
Begin with a complete population of shipping records and trace each eligible shipment to billing. Starting with invoices would not reveal shipments omitted from billing.
6.6
Event logs and process mining
Process mining uses event-log data to reconstruct how transactions actually moved through a process. A useful log normally includes a case identifier, activity, timestamp, and often the user or system performing the activity. The analysis can reveal rework, skipped approvals, unusual sequences, long delays, and variants that a formal flowchart omits.
The method depends on data quality and interpretation. A missing event may mean the activity did not occur, occurred outside the system, or was not logged. A rare process variant may be fraud, a legitimate emergency, or a data error. Accountants combine event patterns with documents, interviews, and control knowledge.
Process mining is especially valuable for population-level questions. Instead of sampling a few purchase orders to see whether approval preceded receipt, the analyst can test the ordering of timestamps across the full logged population and investigate exceptions.
Worked case
Resolve an unmatched vendor invoice at period end
Northstar receives a $48,000 invoice dated June 28 for 400 drive assemblies. The approved purchase order is for 400 units at $120. Receiving shows 350 units on June 29 and 50 units on July 3. The invoice is unpaid at June 30.
Separate authorization from occurrence
The purchase order authorizes up to 400 units at the agreed price, but it does not prove delivery. Receiving evidence establishes which quantity entered Northstar's custody by June 30.
Perform the match
Price agrees at $120 per unit. Quantity differs at June 30: 350 were received, while the invoice bills 400. The system should create or route a quantity exception rather than pay automatically.
Determine the period-end obligation
Assuming the 350 units were accepted and an obligation exists, Northstar should recognize inventory and a liability for $42,000 at June 30 even if the vendor invoice workflow is unresolved. The remaining $6,000 relates to July receipt.
Preserve operational and accounting distinctions
The invoice can remain on payment hold while accounting records the received-not-invoiced or matched liability supported by receipt and order evidence. Payment status is not the same as recognition status.
Investigate the process cause
Determine whether partial shipment was expected, the vendor billed early, receiving was late, or an interface failed. Review similar open receipts and invoices so the issue is not treated as an isolated manual adjustment.
What the case establishes
Three-way matching controls payment, while period-end accounting follows the goods received and obligation incurred. A payment exception does not justify omitting a valid liability.
Common misconceptions
Ideas that sound plausible—but need correction
“A purchase order proves accounts payable.”
It proves authorization and terms. A liability generally requires receipt or another event that creates an obligation, supported by relevant recognition criteria.
“An invoice date determines the accounting period.”
The recognition event may be delivery, performance, acceptance, or another fact. Invoice date is evidence but does not automatically determine cutoff.
Automated roles and workflow can still combine incompatible privileges, permit override, or rely on administrators with broad access.
Mastery practice
Work the problem before opening the solution
Follow documents, duties, quantities, dates, and accounting entries through the full cycle. Evaluate both whether a transaction should occur and whether it is recorded completely and in the correct period.
Problem 1Applied
Walk through a revenue-cycle exception
revenue cycle
assertions
control points
Scenario
A salesperson overrides a credit hold for a $72,000 order. The warehouse ships 80 of 100 units, billing invoices all 100 units, and the customer disputes the final 20. Revenue and the receivable post from the invoice.
Your work
Trace the failure from order through financial statements.
Identify affected assertions and operational objectives.
Design controls at credit approval, shipment, billing, and reconciliation stages.
Need a starting hint?
The override risk and quantity mismatch are separate failures that interact in the same transaction.
Reveal the worked solution
The override allows exposure beyond approved credit. Shipment establishes only 80 units of fulfillment under the facts given, but billing creates a 100-unit receivable and revenue posting. The dispute is a downstream signal of the mismatch.
Occurrence, accuracy, valuation, and possibly cutoff are affected for revenue and receivables; inventory and cost of goods sold can also be wrong. Operationally, credit risk, billing accuracy, customer service, and collection efficiency suffer.
Use independent override authorization with limits and reasons; prevent shipment beyond released quantity; generate invoices from confirmed shipment lines rather than order quantity; match order-shipment-invoice quantities; age unresolved mismatches; and reconcile subledger activity to the ledger. Retain evidence of override, release, shipment, invoice generation, exception review, and correction.
Problem 2Applied
Evaluate a three-way-match exception
expenditure cycle
three-way match
tolerances
Scenario
A purchase order authorizes 500 units at $18.00. Receiving records 490 units. The supplier invoices 500 units at $18.40. System tolerances allow a 3% quantity difference and a 2% price difference. The invoice is scheduled for automatic payment.
Your work
Calculate the quantity and price variances and determine whether each is inside tolerance.
Explain why separate tolerances can still permit a meaningful total overpayment.
Recommend disposition and improvements to tolerance design.
Need a starting hint?
Compare invoice quantity with receipt quantity and invoice price with purchase-order price, then calculate the dollar consequence.
Reveal the worked solution
Quantity difference is 10 units, or about 2.04% of the 490 received, so it is within a 3% tolerance. Price difference is $0.40, or about 2.22% of the $18.00 order price, so it exceeds the 2% tolerance and should block automatic payment.
The invoice totals $9,200, while received quantity at ordered price is $8,820—a $380 difference. Small percentage tolerances applied independently can combine, and high-dollar transactions can create material exposure even within percentage limits.
Route the invoice for investigation; verify outstanding receipts, terms, and approved price changes; pay only the supported amount or hold per policy. Use both percentage and absolute-dollar thresholds, risk-based vendor rules, cumulative exception monitoring, and independent approval for overrides.
Problem 3Challenge
Search for unrecorded liabilities at year-end
completeness
cutoff
subsequent disbursements
Scenario
Northstar closes on December 31. A $95,000 shipment of raw materials arrives December 29 FOB shipping point, receiving enters it January 2, the invoice arrives January 5, and payment occurs January 20. Inventory was physically on hand at year-end but no payable was recorded.
Your work
Analyze the accounting and assertions under the stated shipping terms.
Design procedures that could find this omission even though it is absent from the December payable listing.
Identify process controls that would reduce recurrence.
Need a starting hint?
To find an omitted liability, begin with evidence outside the recorded payable population.
Reveal the worked solution
Assuming the shipping terms transfer control when shipped and the goods are valid, inventory and accounts payable should be recognized by December 31. The omission understates liabilities and inventory and violates completeness and cutoff.
Inspect January cash disbursements and trace to invoices and receipt/shipping evidence; review unmatched receiving records, open purchase orders, vendor statements, invoices received after year-end, and physical inventory records; confirm significant vendors; reconcile receipts around year-end to accruals.
Require timely receiving entry, period-end accrual reports for received-not-invoiced goods, open-PO review, interface monitoring, late-receipt escalation, cutoff procedures, and reconciliation among purchase orders, carrier evidence, receiving, inventory, invoices, and the ledger.
Problem 4Challenge
Interpret a process-mining deviation
process mining
variants
control interpretation
Scenario
Event logs show that 94% of purchases follow Create PO → Approve PO → Receive → Invoice → Pay. Four percent show Invoice → Create PO → Approve → Receive → Pay, and 2% show Create PO → Receive → Invoice → Pay with no approval event.
Your work
Interpret the two deviations without assuming both represent fraud.
Identify data-quality questions that must be answered before concluding the control failed.
Propose follow-up analysis and management action.
Need a starting hint?
An event log shows recorded sequence. It may reveal a true process deviation, a late entry, an interface gap, or a missing event definition.
Reveal the worked solution
Invoice-first cases may be emergency or confirming orders, late PO entry, or policy violations. Missing-approval cases may indicate bypass, approval in another system, migrated records, or incomplete logging. Sequence is a risk signal, not intent evidence.
Validate case IDs, timestamps, time zones, event definitions, system coverage, duplicate and missing logs, automated approvals, canceled documents, and whether approval updates overwrite rather than append history.
Stratify by vendor, buyer, amount, location, urgency, and outcome; inspect representative source evidence; compare with authorized exception policy; quantify value and recurrence; correct logging defects; address unauthorized variants; and monitor whether remediation changes future event paths.
Chapter review
Explain before revealing
Answer each question in your own words. Then open the explanation and compare the logic, not just the vocabulary.
01Why should cash receipt and receipt application be separate records?
The bank event proves cash received, while application determines which customer invoices are reduced. Separation supports unapplied cash and later correction without changing the bank event.
02Which assertion is emphasized when tracing shipping records to invoices?
Completeness, because the procedure begins with shipments that should be billed and checks whether they appear in billing and accounting records.
03What can process mining reveal that a procedure manual cannot?
The actual sequence, repetition, timing, workarounds, bypasses, and variants recorded in system events, including paths that differ from the designed process.
Chapter 7
Part III · Processes and control
Payroll, production, and financial reporting
These cycles convert sensitive master data and operational activity into labor cost, inventory cost, payment, and external reporting.
After this chapter, you should be able to
Trace payroll from employee authorization through payment and reporting.
Explain how production records support inventory and cost accounting.
Describe the general ledger as an integration and reporting hub.
Recognize risks in closing entries, spreadsheets, and management review.
Chapter roadmap
Start with the question, then build the concept
The essential question
How do specialized operational systems become reliable general-ledger balances and financial statements?
Payroll, production, spreadsheets, estimates, interfaces, and closing entries create material balances through different evidence and controls. The general ledger summarizes them but does not explain them.
Before you begin
Understand master data, transaction data, subledgers, and the general ledger.
Recall authorization, completeness, accuracy, classification, and cutoff assertions.
Recognize that estimates and allocations require models and assumptions, not only source documents.
A productive reading sequence
Follow payroll from employee authorization and time through gross-to-net calculation and payment.
Follow production from demand through materials, labor, overhead, work in process, and finished goods.
Study interfaces, journal entries, reconciliations, estimates, and management review during close.
Treat spreadsheets and end-user tools as information systems requiring proportionate controls.
Concepts to hold onto
Gross-to-net
The controlled calculation from authorized earnings through taxes, benefits, and other deductions to employee net pay and related liabilities.
Bill of materials
The approved specification of materials and quantities expected to produce an item, used in planning, issuing, costing, and variance analysis.
Subledger reconciliation
Comparison of detailed records with the corresponding general-ledger control account, including investigation and resolution of differences.
Management review control
A review in which a competent owner uses sufficiently precise information and criteria to identify, investigate, and resolve material unexpected results.
End-user computing
Spreadsheets, databases, scripts, and similar tools created or maintained by business users outside ordinary application-development controls.
7.1
Pay the right person the right amount
Payroll brings together employee master data, time and attendance, compensation rules, benefits, taxes, deductions, payment instructions, and general-ledger mappings. The process handles valuable and confidential data, repeats frequently, and often relies on a service provider. Small master-data errors can recur across many pay periods.
A typical cycle includes authorized hiring, employee setup, time capture, supervisor approval, gross-to-net calculation, payroll review, payment, liability remittance, posting, and reconciliation. Salaried and hourly employees create different risks, but both depend on valid employees and authorized compensation.
Key controls include independent approval of hires and pay changes, restricted master-data access, review of change reports, reasonableness comparisons to prior payroll, segregation of preparation and release, bank reconciliation, and timely removal of terminated employees.
Source figure · Payroll process map
Payroll joins employee data, time evidence, calculations, approvals, and payment
Do not try to memorize every box. Follow one employee from approved time and pay-rate data through gross-to-net calculation, review, payment, and posting. At every handoff, ask what prevents an unauthorized change and what evidence would reveal a missing or duplicated employee.Image credit: MPRI Sandra. Source: Wikimedia Commons. Reuse terms: Public domain.
Figure 7.1 · Gross-to-net payroll
Payroll combines authorized master data with current-period activity
01Employee masterStatus, rate, tax, bank, and deductions
02Time and activityHours, leave, commission, and changes
03Gross payAuthorized earnings calculation
04DeductionsTaxes, benefits, and other withholdings
05Net payPayment, liabilities, and payroll entry
The calculation is only as reliable as employee status, pay rates, time, deductions, tax rules, and payment instructions.
7.2
Time, pay rates, and direct-deposit changes
Time records establish labor effort and may affect payroll, job cost, inventory, customer billing, and project profitability. Supervisory approval should demonstrate knowledge of the work, not become a routine click. Automated checks can flag duplicate time, impossible hours, missing schedules, or entries after termination.
Pay-rate and bank-account changes are high-risk master-data events. Independent notification can help detect account takeover: when direct-deposit information changes, the system notifies the employee through a previously established channel. Sensitive changes close to payroll should receive heightened review or a controlled waiting period.
Reasonableness analytics are useful but should be interpreted. A large increase may indicate an error, bonus, retroactive adjustment, or legitimate overtime. The control must connect the exception to authoritative approval and document the conclusion.
7.3
Production and inventory cost
The production cycle plans what to make, authorizes work, issues materials, records labor and machine activity, reports completed units, and updates inventory and cost records. Bills of materials, routings, work orders, material requisitions, move tickets, and production reports are key evidence.
Standard costs translate expected quantities and rates into a benchmark. Actual activity creates price, usage, rate, and efficiency differences. A variance is a signal for explanation, not automatically an error or poor performance. The underlying data and business conditions determine its meaning.
Controls address unauthorized production, theft of materials, inaccurate bills of material, fictitious completion, unrecorded scrap, and improper overhead allocation. Physical counts and cycle counts compare records with assets, while investigation connects differences to receiving, production, shipping, or master data.
7.4
The general ledger is a hub, not the origin
The general ledger summarizes financial effects from subledgers and journal entries. It supports trial balances, financial statements, consolidations, and management reporting. Because it compresses detail, investigators often move from a general-ledger account to a subledger and then to source events.
Interfaces may post every transaction or summarized batches. Summary posting improves efficiency but increases the importance of control totals and drill-down evidence. The ledger total should reconcile to the contributing subledger, and the subledger should reconcile to authoritative operational records where appropriate.
Manual journal entries are necessary for estimates, allocations, corrections, and transactions not produced by subledgers. Their flexibility creates risk. Controls commonly address preparer and approver independence, supporting documentation, account eligibility, period, unusual users, late entries, round amounts, and post-close activity.
Figure 7.2 · Subsystems to statements
The general ledger summarizes several operational systems
01PayrollTime, rates, taxes, benefits
02ProductionMaterials, labor, overhead
03SubledgersDetailed controlled balances
04General ledgerAccount-level summaries
05StatementsReported financial position and performance
Interfaces and reconciliations preserve the connection between detailed events and summarized financial-statement balances.
7.5
The financial close as a controlled process
The close coordinates subledger completion, reconciliations, estimates, journal entries, consolidation, review, financial-statement preparation, and disclosure. A close checklist is useful only if tasks have clear owners, dependencies, evidence, due dates, and escalation for unresolved differences.
Account reconciliations connect ledger balances to independent or detailed support. A strong reconciliation identifies the population, explains reconciling items, assigns action, and documents review. Carrying the same unexplained difference each month is not resolution.
Management review controls rely on the reviewer’s knowledge and precision. A review of gross margin can detect a large unexpected change if expectations are quantified, disaggregated appropriately, and supported by investigation. A signature without evidence of criteria or follow-up provides little assurance.
Figure 7.3 · Financial close loop
Close quality improves when issues feed back to their source
01CollectReceive subsystem balances and schedules
02ReconcileCompare ledgers with independent evidence
03AdjustRecord supported estimates and corrections
04ReviewAnalyze results, disclosures, and unusual activity
05Report and improveIssue statements and correct root causes
A manual entry may correct the period, but durable improvement requires the upstream process or interface to be repaired.
7.6
Spreadsheets and end-user computing
Spreadsheets often bridge systems during budgeting, tax, valuation, consolidation, and the close. They are powerful because users can build logic quickly. The same flexibility allows hard-coded values, broken formulas, hidden rows, uncontrolled versions, and accidental overwrites.
The level of control should reflect the spreadsheet’s importance and complexity. Key controls may include assigned ownership, input-source reconciliation, locked formulas, change review, version naming, access restriction, reasonableness tests, independent reperformance, and retention of the final approved file.
A spreadsheet control is not simply checking that cells contain formulas. The reviewer should understand the model’s purpose, significant assumptions, data lineage, formulas, outputs, and sensitivity. A technically correct formula can implement the wrong accounting judgment.
Check your understandingWhy is saving a spreadsheet in a restricted folder not enough?
Access control protects the file, but it does not validate inputs, formulas, assumptions, completeness, or review. Critical spreadsheets need controls over both custody and logic.
Worked case
Explain a payroll-to-ledger difference during close
The payroll register shows $1,842,600 of gross pay for the final biweekly payroll. The general-ledger payroll expense posted from the interface is $1,817,600, a $25,000 difference. Net pay and bank funding agree with the payroll file.
Confirm the compared definitions
Determine whether both totals represent the same employees, pay period, earning types, legal entities, currencies, and accounts. Gross pay may include amounts capitalized or charged to another account.
Reconcile by earning and destination
Break gross pay into regular wages, overtime, bonus, leave, production labor, and other categories, then map each category to the interface account and cost center.
Identify the classification
The $25,000 is direct labor assigned to a production work order and posted to work in process rather than payroll expense. It is included in gross pay and cash funding but classified as inventory cost.
Verify the production evidence
Confirm authorized employee time, work-order assignment, production period, rate, and interface mapping. Determine whether capitalization is appropriate and whether the related quantity and overhead records are consistent.
Document the reconciliation
Retain the payroll total, mapped interface output, ledger postings, reconciling item, preparer, reviewer, timing, and resolution. A difference can be legitimate but still requires evidence.
What the case establishes
Cash agreement did not prove expense classification. The reconciliation explains how one payroll population produced several general-ledger accounts and verifies the business basis for the allocation.
Common misconceptions
Ideas that sound plausible—but need correction
“If net pay agrees with the bank, payroll accounting is correct.”
Bank agreement supports payment but not employee validity, gross-to-net accuracy, liability recognition, expense classification, capitalization, or period cutoff.
“A general-ledger balance is the most detailed evidence.”
The ledger is a summary. Subledgers, transaction records, approvals, source evidence, models, and reconciliations explain how the balance was produced.
“A spreadsheet is too simple to be an information system.”
A spreadsheet can import data, apply logic, store assumptions, produce entries, and support material decisions; its controls should match that significance.
Mastery practice
Work the problem before opening the solution
Connect operational quantities and master data to cash, inventory, expenses, and journal entries. Show how each reconciliation closes the loop between a subsidiary process and the general ledger.
Problem 1Applied
Investigate a possible ghost employee
payroll controls
master data
analytics
Scenario
An employee received six biweekly deposits after the HR termination date. The payroll system shows an active status, no recorded hours, a fixed salary, a recently changed bank account, and the same mailing address as a payroll clerk.
Your work
Separate facts, red flags, and conclusions.
Design an investigation that preserves fairness and evidence.
Recommend preventive and detective controls across HR, payroll, treasury, and accounting.
Need a starting hint?
A salaried employee can legitimately have no hours, but termination, bank change, shared address, and continued payment together require investigation.
Reveal the worked solution
The listed records are facts if validated. Continued pay, active status after termination, recent bank change, and a shared address are red flags. They do not alone prove a ghost employee or identify responsibility.
Confirm the termination and any severance or leave terms, validate identity and bank-change evidence, inspect access and change logs, trace deposits, preserve communications, interview under policy, and involve appropriate HR, legal, security, or internal-audit personnel.
Integrate approved HR status with payroll effective dates; independently approve bank changes; restrict payroll master access; reconcile active payroll to HR rosters; review post-termination payments, duplicate accounts and addresses, unusual changes, and returned funds; require independent payroll and cash review.
Problem 2Applied
Explain a production cost variance
standard cost
variance analysis
operational evidence
Scenario
A bicycle model has a standard of 4 kilograms of alloy at $9 per kilogram. Northstar produces 1,000 units, uses 4,300 kilograms, and pays $9.40 per kilogram.
Your work
Calculate the material price and usage variances.
Identify operational explanations and evidence that could distinguish them.
Explain why assigning the entire variance to purchasing would be weak analysis.
Need a starting hint?
Price variance uses actual quantity times actual-minus-standard price. Usage variance uses standard price times actual-minus-standard quantity allowed.
Reveal the worked solution
Price variance is 4,300 × ($9.40 − $9.00) = $1,720 unfavorable. Standard quantity allowed is 4,000 kilograms. Usage variance is $9.00 × (4,300 − 4,000) = $2,700 unfavorable. Total material variance is $4,420 unfavorable.
Possible causes include supplier price changes, rush orders, grade substitution, scrap, machine setup, design changes, training, defects, theft, or incorrect standards. Inspect purchase orders, supplier terms, bills of material, issue records, scrap reports, quality records, work orders, change approvals, and production conditions.
Purchasing influences price and sometimes quality, while production, engineering, quality, planning, and master-data owners influence usage. The two variances interact: lower-cost material could cause higher scrap, or a premium grade could reduce usage. Accountability requires causal evidence, not formula labels alone.
Problem 3Challenge
Assess a manual journal entry
journal-entry controls
management override
evidence
Scenario
At 11:48 p.m. on quarter-end, the CFO posts a $1.2 million debit to accrued revenue and credit to revenue with the description ‘true-up.’ The entry is approved the next morning by a controller who reports to the CFO. It automatically reverses on day one of the next quarter.
Your work
Identify risk indicators without assuming the entry is improper.
List evidence and accounting analysis required to evaluate it.
Design controls that address senior-management override.
Need a starting hint?
Late timing, round amount, vague explanation, unusual account, reversal, and approval relationship are signals that increase required evidence.
Reveal the worked solution
Risk indicators include late posting, large round amount, vague description, direct revenue effect, post-close approval, automatic reversal, and lack of independent challenge. A legitimate estimate can share these features, so evidence determines the conclusion.
Obtain the contract or transaction population, recognition analysis, calculation, assumptions, source data, cutoff support, prior estimates, subsequent outcome, reversal rationale, account mapping, approval history, and impact on targets or covenants. Reperform and test the population.
Require defined supporting fields, pre-approval for specified entries, independent review by someone with authority to challenge executives, restricted posting access, automated high-risk-entry analytics, audit-committee visibility for significant overrides, retrospective estimate review, and retention of immutable workflow evidence.
Problem 4Applied
Repair a spreadsheet-based account reconciliation
reconciliation
end-user computing
review controls
Scenario
A bank-reconciliation workbook imports a bank CSV, pastes the ledger balance manually, uses hidden formulas, and carries old reconciling items forward. The reviewer signs a PDF of the summary but cannot access the workbook or supporting files.
Your work
Identify completeness, accuracy, existence, cutoff, and review risks.
Redesign the reconciliation and review evidence while keeping a spreadsheet-based process.
Define when an old reconciling item should be escalated or written off.
Need a starting hint?
A signature proves that someone signed. It does not prove what population, formulas, support, or exceptions the person reviewed.
Reveal the worked solution
Risks include incomplete bank files, wrong ledger balance, formula changes, hidden logic, duplicated or stale items, unsupported adjustments, wrong dates, and a review that cannot be reperformed.
Use controlled read-only imports, source control totals, protected and visible formulas, separate inputs, unique reconciling-item IDs, dates and owners, automated aging, links to support, preparer certification, reviewer access to the full package, documented review criteria, exception comments, and version retention. Reconcile ending balances and change from prior period.
Policy should define aging and dollar thresholds, responsible owner, required evidence, escalation path, and approval for correction or write-off. Old items should not roll indefinitely; resolution must trace to cash, ledger correction, bank action, or a documented accounting conclusion.
Chapter review
Explain before revealing
Answer each question in your own words. Then open the explanation and compare the logic, not just the vocabulary.
01Why are payroll master-data changes high risk?
Employee status, rates, tax setup, deductions, and bank accounts affect repeated calculations and payments and may be used before anyone notices an error.
02What evidence supports a manual journal entry?
A defined business purpose, authorized preparer and approver, source records, calculation, account and period rationale, attachments, review, and traceable posting.
03What makes a close review sufficiently precise?
The reviewer uses reliable disaggregated information, expectations and thresholds capable of detecting material error, investigates differences, and documents resolution.
Chapter 8
Part IV · Analytics
Data quality, preparation, and exploration
Analytical conclusions are only as defensible as the population, definitions, transformations, and evidence behind them.
After this chapter, you should be able to
Frame descriptive, diagnostic, predictive, and prescriptive questions.
Assess data quality in relation to an accounting purpose.
Document cleaning and transformation without destroying evidence.
Use exploratory analysis to identify patterns, exceptions, and limitations.
Chapter roadmap
Start with the question, then build the concept
The essential question
How can raw organizational data be transformed into an analysis-ready population without losing meaning or evidence?
Most analytical errors begin before a model is fitted. Missing records, inconsistent definitions, wrong grain, uncontrolled transformations, and weak lineage can make sophisticated analysis confidently answer the wrong question.
Before you begin
Understand population, record, field, key, grain, source system, and reconciliation.
Distinguish a true zero from missing, unknown, not applicable, or not yet recorded.
Recognize that an unusual value can be an error, a rare valid event, or the most important observation.
A productive reading sequence
Begin with the decision and define the intended population, grain, period, and variables.
Profile accuracy, completeness, validity, consistency, timeliness, and uniqueness.
Preserve raw data, apply documented transformations, and reconcile after every material stage.
Use exploratory analysis to find questions and exceptions, then return to source evidence before concluding.
Concepts to hold onto
Data quality
Fitness of data for a stated use across dimensions such as accuracy, completeness, validity, consistency, timeliness, and uniqueness.
Reproducibility
The ability of another person to start from the preserved source, apply the documented steps, and obtain the same analytical dataset and result.
Measurement level
The kind of meaning a variable supports—category, ordered category, interval, ratio, identifier, date, or another type—which determines valid operations.
Outlier
An observation unusually distant from others under a stated measure; it is a signal for investigation, not automatic evidence of error or fraud.
Analytical lineage
A trace from report or model output back through features, transformations, extracts, source fields, systems, and business definitions.
8.1
Begin with the decision, not the tool
Descriptive analysis asks what happened. Diagnostic analysis asks why it happened. Predictive analysis estimates what may happen. Prescriptive analysis recommends an action under assumptions and constraints. A single project may move through all four, but the question should be clear at each stage.
An attractive visualization does not repair a vague question. “Analyze expenses” leaves the population, time period, benchmark, and desired action unspecified. “Identify employee expense claims in the second quarter that violate policy or resemble prior duplicates so reviewers can prioritize investigation before reimbursement” is operational and testable.
Accountants should also define the unit of analysis. One row per claim, employee, vendor, or day can produce different patterns. Changing units during analysis without noticing can create misleading counts and averages.
Source figure · CRISP-DM process
An analytics project is iterative, not a straight path from data to answer
Business understanding comes before modeling, and the arrows return to earlier stages when evidence changes the question. For an accounting project, reconciliation, data lineage, control requirements, and the consequences of errors should be considered throughout the cycle—not added only after a model is built.Image credit: Kenneth Jensen. Source: Wikimedia Commons. Reuse terms: CC BY-SA 3.0.
8.2
Quality is fitness for purpose
Common dimensions include completeness, accuracy, validity, consistency, uniqueness, and timeliness. A field may be valid in format but inaccurate in meaning. A date of 2026-02-28 passes a format test; it may still be the wrong invoice date. Data quality must be assessed against the intended decision and authoritative evidence.
Missing values require interpretation. Zero, blank, unknown, not applicable, and not yet available are different states. Replacing all blanks with zero can transform uncertainty into a false fact. The cleaning decision should be documented and, where possible, preserve the original value and a reason code.
Duplicate records are also contextual. Two identical payment rows may represent a duplicate extract, a repeated payment, or two legitimate installments. The analyst uses identifiers, timestamps, source-system knowledge, and supporting evidence before deleting anything.
Figure 8.1 · Data quality is multidimensional
A dataset can be accurate and still be unusable
01AccuracyValues agree with the represented facts
02CompletenessRequired records and fields are present
03ValidityValues satisfy defined formats and rules
04ConsistencyDefinitions agree across sources and periods
05TimelinessData are current enough for the decision
06UniquenessOne real object is not represented repeatedly
Quality should be evaluated for the intended accounting decision, population, timing, and level of evidence.
Data-quality question and accounting consequence
Dimension
Question
Possible consequence
Completeness
Are all eligible shipments present?
Understated billing or revenue
Accuracy
Does bank account match verified evidence?
Misdirected cash
Validity
Is account code allowed?
Rejected posting or misclassification
Consistency
Do systems define customer status alike?
Conflicting reports
Uniqueness
Is this invoice already recorded?
Duplicate liability or payment
Timeliness
Was the receipt recorded before close?
Cutoff error
8.3
A reproducible preparation workflow
Preserve the raw data. Work on a controlled copy or use code and query steps that can be rerun. Profile fields before changing them: count records, inspect types and unique values, calculate missingness, test ranges, and reconcile totals. Then standardize, validate, join, derive, and document.
Each transformation should have a business reason. Standardizing OH, Ohio, and ohio to one state code may be appropriate. Converting a numeric-looking customer ID to a number may be destructive if leading zeros carry meaning. Trimming spaces may be safe for a name but not for a hashed value.
Keep an exceptions table rather than silently dropping records. A failed date, unmatched vendor, or negative quantity may be the most important observation. The final dataset should reconcile to the starting population through retained, excluded, and unresolved categories.
Figure 8.2 · Reproducible preparation
Cleaning should preserve the raw source and explain every change
01Raw extractPreserve unchanged evidence
02ProfileMeasure missing, duplicate, and invalid values
03TransformApply documented rules
04ValidateReconcile counts and totals
05Analysis tableUse a defined population and grain
The final analytic table is stronger when a reviewer can reproduce it from unchanged source data and logged transformations.
8.4
A number’s appearance does not reveal its meaning
Nominal data represent categories without order, such as payment method. Ordinal data have an order but not necessarily equal distances, such as risk ratings. Interval measures have meaningful differences but no true zero, while ratio measures have a meaningful zero. The measurement level affects valid comparisons and calculations.
Accounting datasets contain identifiers that look numeric. Vendor 00147 is not smaller than vendor 00920 in an economic sense. Averaging account numbers is meaningless. Conversely, categorical text may encode business order, such as low, medium, and high risk. Analysts must understand the construct, not infer it from file format.
Operational proxies also deserve skepticism. Number of login events may be used as a proxy for system activity, but automated integrations and shared service accounts can distort it. Before modeling, ask whether the measured field represents the concept the analysis claims to study.
8.5
Explore distributions before trusting summaries
Exploratory data analysis uses counts, distributions, relationships, and visualizations to understand the data before formal modeling. Start with population size, missing values, duplicates, ranges, central tendency, spread, and time patterns. Segment results by meaningful business dimensions.
Means are sensitive to extreme values, while medians describe the middle observation. Neither is universally better. A few very large invoices may be exactly where material risk is concentrated. Outliers should be investigated, not automatically removed.
Time is often a hidden variable. A relationship across the full year may reflect seasonality, a system conversion, or a policy change. Plotting values over time and marking known events can distinguish enduring patterns from one-time transitions.
Figure 8.3 · Exploratory analysis ladder
Move from population checks to explanations carefully
01PopulationRow count, date range, grain, and coverage
02DistributionCenter, spread, missing values, and outliers
03RelationshipsGroups, trends, correlations, and exceptions
04Evidence reviewTrace unusual observations to source records
05Decision questionDetermine what further test or action is justified
Exploration reveals patterns and questions; it does not by itself establish causation or an accounting conclusion.Check your understandingShould an outlier be deleted before analysis?
Not automatically. Verify whether it is a data error, a legitimate rare event, or evidence of the risk being studied. Document any exclusion and evaluate how it changes the conclusion.
8.6
Lineage and evidence for analytics
A defensible analysis identifies data sources, owners, extraction methods, time periods, filters, joins, transformations, assumptions, and known limitations. This lineage allows another person to reproduce the result and evaluate whether the population matches the decision.
Analytical work often moves through several tools. A query extracts ERP data, a spreadsheet maps categories, a script calculates features, and a dashboard displays results. Each handoff can change meaning. Control totals, versioning, code review, and retained parameter files connect the chain.
Documentation is not paperwork added after analysis. Writing down the intended grain and definition often reveals mistakes before the result is produced. For significant decisions, the evidence should allow a reviewer to move from the chart back to the underlying records.
Check your understandingWhat should accompany a chart used in a management control?
At minimum, the population and period, metric definition, source, filters, refresh date, comparison or threshold, and a path to investigate underlying records.
Worked case
Prepare an invoice population for duplicate-payment analysis
Northstar exports 220,418 invoice records from three divisions. Vendor names and invoice numbers use different formats, credit memos contain negative amounts, some dates are blank, and one division stores dollars while another stores cents.
Freeze and describe the source
Preserve each unchanged extract with system, division, date, parameters, row count, total amount, and file integrity information. Define one source row and identify known exclusions before cleaning.
Standardize meaning before format
Confirm currency units, time zones, invoice versus credit types, vendor identifiers, and date definitions. Dividing the cents division by 100 is valid only after the source's unit is established.
Create controlled comparison fields
Retain original fields and create documented normalized versions: remove permitted punctuation from invoice number, standardize case, map vendor IDs, and calculate an absolute or signed comparison amount according to the test design.
Handle missing and unusual values
Do not replace blank invoice dates or vendor IDs with invented defaults. Flag them, trace a sample to source, determine cause and materiality, and decide whether they require correction, separate testing, or exclusion disclosure.
Reconcile and validate candidates
Reconcile rows and signed totals after each transformation. Test known duplicates and known nonduplicates. Treat matched invoice number, vendor, amount, and nearby date as an investigation candidate, not proof of duplicate payment.
What the case establishes
The analysis is credible because source facts remain intact, unit and definition differences are resolved explicitly, missing values stay visible, and transformed populations reconcile to the extracts.
Common misconceptions
Ideas that sound plausible—but need correction
“Cleaning means deleting messy records.”
Cleaning means understanding, documenting, transforming, validating, and sometimes separating records. Deletion requires a justified population rule and disclosed impact.
“Missing values should usually be replaced with zero.”
Zero is a substantive value. Replacement is appropriate only when business rules establish that missing truly means zero and the transformation is documented.
“Outliers distort analysis and should be removed.”
Outliers may reveal error, fraud, control failure, or a valid rare transaction. Investigate and use a defined treatment rather than deleting mechanically.
Mastery practice
Work the problem before opening the solution
Treat preparation as an accounting procedure. Preserve raw evidence, document every transformation, reconcile the transformed population, and explain how each choice changes the conclusion.
Problem 1Applied
Create a defensible analysis population
population
grain
reconciliation
Scenario
Three divisions provide payment extracts. East has 38,420 rows totaling $94.8 million, Central has 25,110 rows totaling $61.2 million, and West has 31,870 rows totaling $77.5 million. After combining files, the analyst has 95,380 rows totaling $233.1 million because 20 rows are rejected for invalid dates and 7,300 records lack a division code after a column-mapping error.
Your work
Reconcile the expected row count and amount with the combined result.
Explain why the amount difference alone cannot locate the problem.
Design a controlled ingestion and exception process.
Need a starting hint?
First compute expected count and amount. Then account separately for rejected rows, mapping failures, duplicates, and any amount change.
Reveal the worked solution
Expected count is 38,420 + 25,110 + 31,870 = 95,400 rows. The combined file has 20 fewer rows, matching the rejected-date count. Expected amount is $233.5 million, so the transformed population is also $0.4 million lower. The 7,300 missing division codes do not explain missing rows but show a classification failure.
A net $0.4 million difference could combine omitted positive payments, duplicated records, sign changes, currency conversions, or rounding. Net totals can conceal offsetting errors and do not identify which records failed.
Preserve read-only source files and file hashes; define schemas, field mappings, date and amount rules, and source IDs; produce sent, accepted, rejected, duplicate, null, count, and amount controls by division; quarantine rather than delete failures; assign exceptions; correct mappings through versioned code; rerun; and reconcile every source and output before analysis.
Problem 2Challenge
Handle missing values without inventing facts
missing data
null meaning
sensitivity analysis
Scenario
In a customer-credit dataset, 14% of annual-revenue values are missing. Missingness is 3% for large established customers and 41% for new small customers. An analyst proposes replacing every missing value with the overall median before estimating default risk.
Your work
Explain why the missingness pattern matters.
Compare deletion, simple median imputation, group-based treatment, and a missingness indicator.
Design sensitivity checks and disclosure for users of the model.
Need a starting hint?
The values are not missing uniformly. The fact that a value is missing may itself carry information about customer type and process quality.
Reveal the worked solution
Missingness is associated with customer age and size, which may also relate to default. Treating it as random can distort both the sample and the relationship between revenue and risk.
Deletion removes many small new customers and can bias the population. Overall-median imputation makes unlike customers appear similar and understates uncertainty. Group-based imputation may be more plausible but still creates modeled values. A missingness indicator lets the model distinguish observed from imputed cases, though it does not repair the underlying process.
Compare results under deletion, overall and group-based imputation, indicator methods, and a model excluding the field; report performance by customer segment and missingness status; document assumptions, proportions, source process, and uncertainty; and investigate why revenue is not collected for the high-missingness group.
Problem 3Applied
Investigate an outlier before removing it
outliers
business context
audit evidence
Scenario
Most employee reimbursements are below $3,000. One $182,000 record belongs to the CEO, has category ‘Travel,’ and was paid in four installments. The data scientist labels it an outlier and plans to delete it before calculating spending patterns.
Your work
List plausible explanations spanning error, valid unusual activity, and misconduct.
Describe evidence needed to classify the record.
Explain how treatment should differ for descriptive reporting, predictive modeling, and control testing.
Need a starting hint?
An outlier is a statistical description, not a reason for deletion. Rare records may be exactly what a control analysis is intended to find.
Reveal the worked solution
Possibilities include a decimal or currency error, misclassified corporate travel, group-event costs, executive relocation, duplicate aggregation, valid but unusual travel, policy exception, or improper personal expenditure.
Inspect original claim, receipts, purpose, dates, travelers, approvals, policy, allocation, installment logic, bank evidence, currency, related transactions, data transformations, and executive-approval requirements.
Descriptive reporting may show results with and without the item and explain its influence. Predictive modeling may transform, cap, stratify, or retain it depending on deployment population, with sensitivity testing. Control testing should generally preserve and investigate it because unusual magnitude and executive status are risk-relevant.
Problem 4Foundation
Choose a valid measure and visual comparison
measurement level
rates
visualization
Scenario
Division A has 90 control exceptions in 9,000 transactions. Division B has 35 exceptions in 1,000 transactions. A dashboard uses a bar chart of exception counts and labels A the highest-risk division.
Your work
Calculate exception rates and reassess the conclusion.
Explain when counts and rates are each useful.
Design a more informative visual and specify necessary context.
Need a starting hint?
Different exposure volumes require a denominator, but a very small denominator also increases uncertainty.
Reveal the worked solution
Division A's rate is 90/9,000 = 1.0%. Division B's rate is 35/1,000 = 3.5%. A has more exceptions by count, while B has a higher observed rate.
Counts help plan investigation workload and total exposure; rates compare frequency after scaling for volume. Dollar severity, transaction mix, control design, and statistical uncertainty may also matter.
Show both count and rate, perhaps with transaction volume and dollar exposure in a small-multiple or dot-and-bar design. Use a consistent period and definition, disclose exclusions and denominators, add prior-period or benchmark comparison, and avoid implying causality from the visual alone.
Problem 5Challenge
Build a reproducible duplicate-payment analysis
reproducibility
normalization
analytical lineage
Scenario
An analyst manually edits vendor names, removes punctuation from invoice numbers, deletes 146 ‘obvious false positives,’ and sends a spreadsheet of 28 possible duplicate payments. No transformation log or original record IDs remain.
Your work
Identify why the result cannot be independently reproduced or fully investigated.
Specify a reproducible pipeline from source extraction to resolved exception.
Propose validation metrics beyond the number of detected pairs.
Need a starting hint?
Keep original and standardized values side by side, and treat every exclusion as a rule or documented disposition rather than an invisible deletion.
Reveal the worked solution
Manual edits are not encoded, deleted candidates cannot be reviewed, original identifiers and values are lost, and no one can prove population completeness or explain why 28 cases remain. The file is an unsupported conclusion rather than durable analytical evidence.
Use a dated read-only extract with control totals; scripted and versioned standardization; preserved original fields and IDs; documented candidate rules; stable pair identifiers; a full candidate table; reviewer dispositions with reasons and evidence; separate confirmed, false-positive, and unresolved statuses; and reconciliation from source through final reporting.
Track source completeness, transformation failures, candidate count by rule, precision from reviewed cases, estimated recall using seeded or known duplicates, dollars identified and recovered, age to resolution, recurrence by root cause, false positives by vendor type, and changes in results when thresholds vary.
Chapter review
Explain before revealing
Answer each question in your own words. Then open the explanation and compare the logic, not just the vocabulary.
01Why preserve original fields when creating standardized versions?
Original values provide evidence, support traceability, allow alternative transformations, and make it possible to inspect whether standardization created false matches or lost meaning.
02What should be reconciled during data preparation?
Row counts, relevant totals, key populations, rejected or unmatched records, period coverage, and known cases should be reconciled at material transformation stages.
03Why is exploratory analysis not a final conclusion?
It reveals associations and unusual patterns but does not automatically establish data validity, causation, intent, accounting treatment, or control failure.
Chapter 9
Part IV · Analytics
Regression, classification, and decision trees
Models summarize patterns in historical data; accountants decide whether those patterns are relevant, reliable, and appropriate for action.
After this chapter, you should be able to
Interpret a regression relationship without confusing prediction and causation.
Explain classification as estimating or assigning categories.
Describe how a decision tree partitions observations.
Separate training performance from performance on unseen cases.
Chapter roadmap
Start with the question, then build the concept
The essential question
How can a model summarize patterns or predict outcomes without being mistaken for causal proof or future certainty?
Regression and classification convert historical relationships into fitted values, scores, and decision rules. Accountants must understand residuals, overfitting, train-test separation, error costs, and evidence before using a model in a workflow.
Before you begin
Understand observations, variables, averages, variation, and the difference between an input and an outcome.
Be able to distinguish prediction from explanation and association from causation.
Recall that historical accounting data reflect existing processes, controls, policies, and errors.
A productive reading sequence
Interpret the intercept, slope, fitted value, and residual in business units.
Separate prediction from causal claims and identify possible confounding or leakage.
Compare numerical prediction with classification and decision-tree paths.
Use training, validation, and test data to estimate how the model behaves on unseen cases.
Concepts to hold onto
Fitted value and residual
The fitted value is the model's expected outcome for an input. The residual is observed outcome minus fitted value and represents what that model did not explain for the observation.
Prediction versus causation
Prediction estimates an outcome from available patterns. Causation claims that changing one factor would change the outcome, requiring stronger design and assumptions.
Classification
Assignment of a record to a category, often by comparing a model score or probability with a chosen threshold.
Decision tree
A model that repeatedly splits observations using questions about features until each terminal group receives a prediction or class.
Overfitting
Learning noise and peculiarities of training data so closely that performance deteriorates on new observations.
9.1
Linear regression as a compact relationship
Linear regression describes how an outcome tends to change with one or more predictors. In a simple model, the intercept is the predicted outcome when the predictor is zero, and the slope is the predicted change in the outcome for a one-unit increase in the predictor. Interpretation must respect units and the range of observed data.
A fitted line summarizes variation; it does not explain every observation. Residuals are the differences between actual and predicted values. Their size and pattern help reveal poor fit, missing nonlinear relationships, changing variance, and unusual observations.
Accounting applications include cost estimation, sales forecasting, allowance analysis, and analytical procedures. The model is evidence, not an automatic conclusion. The accountant evaluates data quality, assumptions, business changes, and whether the relationship is stable enough for the intended use.
Figure 9.1 · Regression residuals
A residual is the vertical gap between an observation and its fitted value
The fitted line represents the model's expected outcome at a given x. The residual is observed y minus fitted y—the portion the fitted relationship does not explain.Image credit: Sigbert. Source: Wikimedia Commons. Reuse terms: CC0 1.0.
9.2
Prediction is not causation
A predictor can improve forecasts without causing the outcome. Late-night journal entries may be associated with errors because unusual adjustments occur during stressful closes. The timestamp itself may not cause the error. Staffing, complexity, deadline pressure, and entry type may drive both.
Causal claims require a credible explanation of what would have happened under an alternative action. Confounding variables, reverse causality, selection, and measurement choices can make an association misleading. Accountants should use careful language: associated with, predicts, or is consistent with are not the same as causes.
This distinction affects control decisions. Blocking every late-night entry might disrupt legitimate close activity without addressing poor planning or complex estimates. A predictive alert can prioritize review even when the causal mechanism remains uncertain.
9.3
Classification predicts categories
Classification assigns observations to categories or estimates the probability of a category. Examples include likely duplicate versus not duplicate, high-risk versus ordinary journal entry, or likely late payment versus likely on-time payment. Many models produce a score or probability that must be converted into action through a threshold.
The target label must be meaningful. Historical investigation outcomes may be incomplete or biased toward transactions that previous rules selected. A model trained on detected fraud learns the detection process as well as the underlying behavior. Missing labels do not necessarily mean negative cases.
Class imbalance is common. If only 0.2% of payments are fraudulent, a model that predicts no fraud is 99.8% accurate and completely useless for detection. Evaluation must focus on the costs and benefits of errors, not headline accuracy.
9.4
How a decision tree partitions data
A decision tree asks a sequence of questions that divide observations into increasingly similar groups. A payment-risk tree might first ask whether vendor bank data changed recently, then whether the change received independent verification, then whether the payment exceeds a threshold. Each path ends in a prediction or score.
Trees are appealing because their paths can be explained, but a displayed tree may still be unstable or overly complex. Small data changes can produce different splits. Deep trees can memorize training cases, including noise. Pruning, minimum leaf sizes, and validation help control complexity.
The split criterion measures how much a candidate question reduces impurity or uncertainty. Students do not need to worship the formula to understand the logic: a useful split creates child groups that are more decisive about the target than the parent group.
Figure 9.2 · Learned decision tree
A tree partitions cases one question at a time
Start at the root, apply the split condition, and follow one branch until a leaf. The same reading process applies to an accounting tree built for invoice exceptions, even though its features and outcomes would differ.Image credit: scikit-learn developers. Source: scikit-learn decision-tree documentation. Reuse terms: BSD-3-Clause.
9.5
Learn on one set; judge on unseen cases
Training data are used to estimate model parameters or rules. Validation data support model selection and threshold tuning. Test data provide a final estimate of performance on cases not used in development. Repeatedly checking the test set while redesigning the model leaks information and makes the final estimate optimistic.
Random splitting may be inappropriate when time or related records matter. Training on later transactions and testing on earlier ones does not resemble future use. Placing invoices from the same vendor in both sets can allow vendor-specific patterns to leak across the split. Time-based and group-based validation can better represent deployment.
Performance can deteriorate when business processes, customer behavior, systems, or fraud strategies change. Ongoing monitoring compares data and outcomes with the development environment and defines triggers for investigation, recalibration, or retirement.
Source figure · Training and test comparison
A model that fits training data best may generalize worst
The flexible curve follows the training observations closely, including noise. On unseen test cases, its instability becomes visible. In accounting applications, the same problem can occur when a model memorizes vendors, periods, or system codes that will not represent future work.Image credit: Skbkekas. Source: Wikimedia Commons. Reuse terms: CC BY 3.0.
Figure 9.3 · Honest model evaluation
Keep unseen cases separate until the model is ready
01Training setEstimate patterns and parameters
02Validation setChoose features, thresholds, and settings
03Test setEstimate final out-of-sample performance
04DeploymentMonitor actual decisions and outcomes
Training fits the model, validation informs choices, and the untouched test set estimates performance on new cases.Check your understandingWhy is training accuracy an inadequate measure of model quality?
A flexible model can memorize the training data. The relevant question is how it performs on representative unseen cases, using metrics aligned with the decision and error costs.
9.6
Model output is one item of evidence
A high-risk score does not prove fraud, and a low-risk score does not prove legitimacy. The score prioritizes or informs a decision under assumptions. Human reviewers need relevant source evidence, understandable reason codes where feasible, and authority to disagree.
Evaluation should include technical performance and process performance. Does the model improve detection or efficiency? Can reviewers act on the output? Are alerts timely? Are investigations consistent? Do errors concentrate in particular groups or transaction types? Can the organization document and challenge the system?
A model control includes ownership, approved purpose, data and version lineage, performance thresholds, access, change procedures, monitoring, and incident response. Without these surrounding controls, even a strong model can produce an unreliable business process.
Check your understandingWhat should a reviewer see with a high-risk journal-entry alert?
The entry and source details, relevant reasons or features, supporting documents, applicable policy, comparison population, and a clear way to document the investigation and outcome.
Worked case
Evaluate a model that predicts monthly warranty expense
Northstar fits a linear regression using units sold to predict monthly warranty claims. The estimated equation is Warranty Expense = $18,000 + $7.40 × Units Sold. July sales are 10,000 units, and actual July warranty expense is $101,000.
Interpret the equation
The intercept is the model's fitted expense at zero units within its mathematical form; it is not automatically a meaningful fixed cost outside the observed range. The slope associates each additional unit with $7.40 of expected warranty expense.
Calculate and interpret the fitted value
The fitted July value is $18,000 + $7.40 × 10,000 = $92,000. This is the model's estimate given July units, not a guaranteed obligation or journal-entry amount.
Calculate the residual
The residual is $101,000 − $92,000 = $9,000. July expense was $9,000 above the model estimate. Investigate product mix, claim severity, policy changes, data timing, and unusual events before interpreting the difference.
Challenge causal language
The slope does not prove that selling one more unit causes exactly $7.40 of expense. Product quality, mix, warranty terms, reporting delays, and service campaigns may affect both sales and claims.
Evaluate out of sample and in process
Compare performance on months not used for fitting, inspect residual patterns and high-volume periods, compare with current estimation practice, and define how management reviews and documents model-assisted estimates.
What the case establishes
The model provides a disciplined expectation and investigation signal. Accounting still requires current evidence, recognition judgment, uncertainty assessment, control, and documentation.
Common misconceptions
Ideas that sound plausible—but need correction
“A high R-squared proves the model is correct.”
It describes variation explained in the fitted sample, not causality, data validity, absence of bias, correct specification, or future performance.
“A decision tree explains why an event happened.”
It shows the predictive path learned from features. The splits may reflect proxies, historical policies, or correlations rather than causal mechanisms.
“Randomly splitting rows always creates an honest test.”
Time, customer, vendor, or transaction relationships can leak information across sets. The split should reflect the intended future use and independence structure.
Mastery practice
Work the problem before opening the solution
Show the calculation, interpretation, validation, and decision consequence. A model result is incomplete until you explain what it does not establish and how performance will be checked on unseen data.
Problem 1Applied
Interpret a cost regression and residual
linear regression
prediction
residual
Scenario
A fitted monthly warranty-cost model is: Predicted cost = $18,000 + $7.40 × Units sold. In April, Northstar sells 10,000 units and records $101,000 of warranty cost.
Your work
Calculate predicted cost and the April residual using actual minus predicted.
Interpret the intercept, slope, and residual in business language.
Identify at least four questions to ask before relying on the model for budgeting or control monitoring.
Need a starting hint?
A positive residual means actual cost exceeded the fitted value under the stated residual convention.
Reveal the worked solution
Predicted cost is $18,000 + $7.40 × 10,000 = $92,000. The residual is $101,000 − $92,000 = $9,000 unfavorable relative to the model.
The intercept is estimated cost when units are zero, though that value may be outside the observed range and may not represent a literal fixed cost. The slope estimates a $7.40 change in expected cost per additional unit within the modeled range. The residual is the unexplained April difference, not automatically an error.
Ask about training period, product mix, inflation, seasonality, claims timing, accounting-policy changes, unusual recalls, nonlinear patterns, influential observations, residual behavior, range of units, out-of-sample error, and whether the decision requires prediction or causal explanation.
Problem 2Challenge
Distinguish prediction from causation
causation
confounding
decision limits
Scenario
A regression finds that branches with more internal-audit hours have more control deficiencies. A manager concludes that internal audit causes deficiencies and proposes reducing audit hours.
Your work
Explain at least three reasons the observed relationship may not be causal.
Identify additional data or research designs that would improve the analysis.
Write a responsible management conclusion based only on the stated evidence.
Need a starting hint?
Riskier branches may receive more audit attention, and greater testing can reveal deficiencies that already existed.
Reveal the worked solution
Reverse causality is plausible because known risk drives audit hours. Detection intensity matters because more testing finds more issues. Confounders such as branch size, transaction volume, system changes, prior incidents, management turnover, or regulatory exposure can influence both hours and deficiencies.
Measure risk and size covariates, distinguish new from known issues, consider deficiencies per procedure or exposure, use temporal ordering, compare similar branches, examine policy-driven changes in audit allocation, and use quasi-experimental or randomized designs only where ethical and operationally feasible.
The current data show an association useful for predicting where deficiencies are observed; they do not show that reducing audit work will reduce underlying deficiencies. Management should investigate risk allocation and detection effects before changing assurance coverage.
Problem 3Applied
Detect overfitting with a train-test comparison
training set
test set
overfitting
Scenario
Model A classifies invoice exceptions with 99% training accuracy and 68% test accuracy. Model B has 84% training accuracy and 81% test accuracy. The historical exception rate is 20%.
Your work
Compare the two models and explain which result signals overfitting.
Explain why accuracy alone is insufficient with a 20% exception rate.
Propose validation procedures before deployment.
Need a starting hint?
A model that predicts every invoice as normal already achieves 80% accuracy.
Reveal the worked solution
Model A's 31-point train-test gap strongly signals that it learned training-specific noise or leakage. Model B generalizes more consistently and may be preferable even though its training score is lower.
The no-skill all-normal rule scores 80%, so 81% accuracy may add little. Precision, recall, false-positive rate, false-negative cost, calibration, workload, and performance by subgroup are necessary.
Use time-appropriate holdout data, prevent records from the same invoice or vendor leaking across splits, compare with simple baselines, tune only on training/validation data, lock a final test set, inspect subgroup and period performance, stress edge cases, conduct error analysis, and define post-deployment drift and outcome monitoring.
Problem 4Challenge
Manually evaluate a decision-tree split
decision trees
Gini impurity
interpretability
Scenario
A node contains 100 payments: 20 confirmed exceptions and 80 normal payments. Candidate split A produces Left: 15 exceptions and 15 normal; Right: 5 exceptions and 65 normal. Candidate split B produces Left: 18 exceptions and 42 normal; Right: 2 exceptions and 38 normal.
Your work
Compute the parent Gini impurity and the weighted child impurity for each split.
Select the stronger split based on impurity reduction.
Explain why the stronger statistical split may still be unsuitable for production.
Need a starting hint?
For a node with class shares p and 1−p, Gini = 1 − p² − (1−p)². Weight each child by its share of the 100 records.
Reveal the worked solution
Parent Gini is 1 − 0.20² − 0.80² = 0.32. For A, left Gini is 0.50 and right Gini is about 0.133; weighted impurity is 0.30×0.50 + 0.70×0.133 ≈ 0.243, for reduction about 0.077.
For B, left exception share is 0.30, so Gini is 0.42; right share is 0.05, so Gini is 0.095. Weighted impurity is 0.60×0.42 + 0.40×0.095 = 0.290, for reduction 0.030. Split A is stronger by this criterion.
The feature may leak the outcome, be unavailable at decision time, encode a prohibited or unstable proxy, produce too few cases for reliable estimates, create unacceptable subgroup effects, or impose a control action whose cost outweighs benefit. Statistical separation is only one design criterion.
Problem 5Applied
Design monitoring for model drift
model drift
monitoring
governance
Scenario
A payment-classification model performed well during testing. Six months later, Northstar changes its ERP, adds international vendors, and introduces virtual cards. Alert volume falls 45%, but confirmed loss rises.
Your work
Identify possible data, concept, process, and measurement drift.
Specify leading and lagging monitoring measures.
Define trigger-based actions rather than merely ‘watching the dashboard.’
Need a starting hint?
The relationship among inputs, outcomes, and recorded labels can change at the same time the operating process changes.
Reveal the worked solution
ERP fields and coding may create data drift; international vendors and virtual cards change the population; fraud patterns and control responses create concept drift; review and confirmation practices can alter labels. Lower alert volume may reflect missing fields or changed thresholds rather than lower risk.
Leading measures include missingness, category and score distributions, feature ranges, population mix, rule coverage, alert volume, reviewer capacity, and system errors. Lagging measures include precision, recall where labels mature, confirmed loss, recovery, override rates, time to disposition, and performance by payment type and region.
Define thresholds that trigger data-lineage review, rollback, threshold adjustment, retraining, parallel testing, control supplementation, broader sampling, or temporary suspension. Assign owners, response times, approval authority, documentation, and conditions for returning to service.
Chapter review
Explain before revealing
Answer each question in your own words. Then open the explanation and compare the logic, not just the vocabulary.
01Why inspect residuals rather than only an average error metric?
Residual patterns can reveal nonlinearity, bias, changing variance, unusual periods, missing variables, data errors, and groups where the model behaves differently.
02What is data leakage?
Information unavailable at the intended decision time, or information from the target or test population, enters model development and makes performance appear unrealistically strong.
03Why keep a final test set untouched?
Repeatedly using test results to choose features or settings turns the test set into development data and produces an optimistic estimate of unseen-case performance.
Chapter 10
Part IV · Analytics
Logistic models, evaluation, and clustering
Thresholds and distance choices convert mathematical output into business consequences.
After this chapter, you should be able to
Interpret logistic output as an estimated probability rather than a guaranteed outcome.
Use a confusion matrix to explain false positives and false negatives.
Choose metrics and thresholds based on decision costs and capacity.
Explain clustering as grouping observations without a known target label.
Chapter roadmap
Start with the question, then build the concept
The essential question
How do probabilities, thresholds, error types, and similarity choices become operational accounting decisions?
A model score does not decide what to investigate, block, approve, or ignore. Management choices about thresholds, review capacity, error costs, scaling, and action determine the system's real consequences.
Before you begin
Understand probability as a value from 0 to 1 rather than a certainty label.
Distinguish the model's score from the organization's decision threshold.
Recall that variables measured in large units can dominate distance unless scaled.
A productive reading sequence
Interpret logistic output as an estimated probability under the model and data.
Build the confusion matrix and calculate precision and recall from actual outcomes.
Choose a threshold using error costs, alert volume, reviewer capacity, and affected parties.
For clustering, define similarity through features, scaling, distance, and intended business use.
Concepts to hold onto
Calibration
Agreement between predicted probabilities and observed frequencies; among cases scored near 0.20, roughly 20 percent should experience the outcome under good calibration.
Precision
Among cases the system flagged, the proportion that actually had the target outcome: true positives divided by all positive predictions.
Recall
Among all cases that actually had the target outcome, the proportion the system flagged: true positives divided by all actual positives.
Threshold
The selected score boundary that converts a continuous model output into an alert, class, or workflow action.
Clustering
An unsupervised method that groups records according to a defined measure of similarity without known outcome labels.
Logistic regression connects predictors to the log-odds of a binary outcome and transforms the result into a probability between zero and one. Unlike a linear probability model, it cannot predict a probability below zero or above one. The coefficients are not direct percentage-point effects without further calculation.
For most accounting users, the key interpretation is conditional: given the model, data, and features, this observation received an estimated probability. The estimate is not personal certainty and may be poorly calibrated. If cases scored near 0.70 experience the outcome only 0.35 of the time, the ranking may still be useful while the probability interpretation is misleading.
Features should be available at decision time. A model that predicts late payment using a field entered only after collection has leaked future information. It will appear powerful in testing and fail in actual use.
Source figure · Logistic probability curve
Logistic regression converts an unbounded score into a probability
Read the vertical axis as estimated probability. Very negative model scores approach zero, very positive scores approach one, and the middle of the curve is where a similar score change has the largest probability effect. The curve bounds the output; it does not guarantee that the probability is well calibrated.Image credit: Qef. Source: Wikimedia Commons. Reuse terms: Public domain.
10.2
The confusion matrix makes errors visible
A true positive is a positive case correctly flagged. A true negative is a negative case correctly cleared. A false positive is an ordinary case flagged, creating unnecessary review or interruption. A false negative is a positive case missed, allowing the risk to pass. Both error types matter, but their consequences differ.
Precision asks: among flagged cases, what proportion were actually positive? Recall asks: among actual positive cases, what proportion were flagged? Specificity measures the proportion of negative cases correctly cleared. The appropriate emphasis follows the decision.
Metrics should be paired with volumes. A precision of 20% may sound low, but if manual review previously found one issue in 500 cases, finding one in five may be operationally valuable. Conversely, even high recall may create more alerts than the team can investigate.
Figure 10.1 · Confusion matrix
Classification performance is a table of actual and predicted outcomes
Values on the diagonal are correct classifications; off-diagonal values are errors. In a two-class accounting application, those cells become true positives, false positives, false negatives, and true negatives.Image credit: scikit-learn developers. Source: scikit-learn confusion-matrix example. Reuse terms: BSD-3-Clause.
Illustrative review results for 10,000 payments
Actually high risk
Actually ordinary
Flagged
80 true positives
320 false positives
Not flagged
20 false negatives
9,580 true negatives
10.3
A threshold is a policy decision
A probability model ranks cases; a threshold converts scores into categories or actions. Lowering the threshold usually catches more positive cases and creates more false positives. Raising it usually reduces review volume and misses more positives. There is no universally correct threshold.
The threshold should reflect error costs, review capacity, control alternatives, materiality, and customer or employee consequences. Some systems use tiers: block the highest-risk events, route a middle group for review, and allow lower-risk events while monitoring the population.
Thresholds should be approved, documented, and monitored. If teams quietly increase the threshold because alerts are burdensome, the control’s effective precision changes without formal risk acceptance.
Source figure · ROC curve
Each point on an ROC curve represents a different classification threshold
Moving the threshold changes both the true-positive and false-positive rates. A curve can summarize ranking performance across thresholds, but it cannot choose the accounting policy: loss exposure, review capacity, customer impact, and alternative controls still determine the operating point.Image credit: scikit-learn developers. Source: scikit-learn ROC example. Reuse terms: BSD-3-Clause.
Figure 10.2 · Threshold trade-off
The model produces a score; the organization chooses an action boundary
01Lower thresholdMore alerts and usually higher recall
02CostMore false positives and review effort
03Higher thresholdFewer alerts and usually higher precision
04CostMore true exceptions may be missed
Changing the threshold does not retrain the model, but it changes alert volume, error types, and reviewer workload.
10.4
Clustering finds groups without a target label
Clustering groups observations based on similarity when no known outcome label guides learning. It can help segment customers, vendors, transactions, or operating locations. The algorithm does not discover natural truth; it creates groups from selected features, scales, distance definitions, and the requested number or structure of clusters.
Feature preparation strongly influences the result. Dollar value can dominate a distance measure if other features are small percentages. Standardization may give variables more comparable influence, but it also embeds a judgment that one standard deviation in each feature should matter similarly.
Clusters require interpretation and validation. A cluster is not automatically high risk or a market segment. Analysts inspect its characteristics, stability, business meaning, and usefulness. Naming a cluster after seeing its average features is a human interpretation, not an output produced by mathematics alone.
Figure 10.3 · K-means clustering
Discovered clusters are not automatically the same as real-world categories
The left panel shows algorithmic groupings and the right panel shows known species. The comparison illustrates why cluster labels require interpretation and validation before they support an accounting decision.Image credit: Chire. Source: Wikimedia Commons. Reuse terms: Public domain.
10.5
Similarity is a modeling decision
Euclidean distance measures straight-line separation across numeric features. Other measures can handle categories, binary attributes, or differently shaped relationships. The choice defines what similar means. Transactions close in dollar value may differ completely in vendor, geography, timing, or approval path.
Scaling can prevent a large-unit feature from dominating. Suppose invoice amount ranges to $1,000,000 while approval-delay days range from zero to ten. Without scaling, amount will usually dominate Euclidean distance. With scaling, delay may receive far more influence. Neither choice is neutral.
Feature selection should connect to the analysis purpose and be reviewed for proxies. Geography, schedule, or job-related attributes can reflect protected or sensitive characteristics. Even an unsupervised method can create consequential groups that deserve fairness and governance review.
Source figure · Silhouette analysis
Cluster separation can be inspected instead of accepted on appearance alone
The right panel shows the groups; the left panel measures how well each observation fits its assigned cluster relative to neighboring clusters. Strong separation is useful technical evidence, but it does not establish that the clusters are stable, fair, or meaningful for an accounting decision.Image credit: scikit-learn developers. Source: scikit-learn silhouette-analysis example. Reuse terms: BSD-3-Clause.Check your understandingWhy can two analysts obtain different clusters from the same records?
They may choose different features, scaling, distance measures, algorithms, numbers of clusters, or random starting points. Each choice changes the definition of similarity.
10.6
Evaluate the whole decision system
Technical metrics describe model behavior on labeled data. Business evaluation asks whether the complete workflow improves outcomes compared with the current process. Measure alert volume, investigation time, confirmed findings, prevented loss, delayed legitimate activity, user overrides, and downstream corrections.
A model can improve one metric while harming the system. Higher recall may overwhelm reviewers, causing alerts to age until they are no longer useful. A cluster analysis may produce insightful segments that no business process can act upon. A calibrated probability may still rely on prohibited or unavailable data.
Before deployment, define success, unacceptable outcomes, fallback procedures, monitoring, and ownership. After deployment, compare actual results with those expectations and retain the ability to change or stop the system.
Check your understandingWhat is the most important model metric?
There is no universal answer. Choose metrics that represent the decision, error costs, affected people, review capacity, and control objective, and evaluate them alongside operational outcomes.
Worked case
Choose a threshold for payment-review alerts
A model scores 10,000 payments for material exception risk. At threshold 0.70 it flags 200 payments: 80 are confirmed material exceptions and 120 are not. The remaining population contains 20 material exceptions the model did not flag.
Build the confusion-matrix counts
True positives are 80, false positives 120, and false negatives 20. The remaining 9,780 payments are true negatives under the confirmed outcome definition.
Calculate precision and recall
Precision is 80 ÷ 200 = 40 percent: two of every five alerts are confirmed. Recall is 80 ÷ 100 = 80 percent: four of every five known material exceptions are found.
Connect errors to consequences
False positives consume reviewer time and may delay legitimate payment. False negatives allow material exceptions to pass. Their costs depend on amount, reversibility, vendor effects, and complementary controls.
Consider operational capacity
If reviewers can investigate only 100 cases before payment, a 200-alert threshold creates backlog. Options include a higher threshold, risk tiers, additional rules, more capacity, or reviewing some alerts after payment.
Monitor actual outcomes
Track alert aging, override, confirmed severity, missed cases, vendor delays, model drift, and subgroup outcomes. Threshold selection should be revisited when prevalence, costs, capacity, or process changes.
What the case establishes
The best threshold is not a mathematical constant. It is a controlled policy choice connecting model behavior to risk tolerance, workflow capacity, and consequences.
Common misconceptions
Ideas that sound plausible—but need correction
“A 0.80 score means the payment is 80 percent fraudulent.”
It is an estimated probability for the defined target under a particular model and data. Calibration, population, and target definition must be evaluated.
“Lowering the threshold improves the model.”
It changes the operating decision, usually increasing alerts and recall while also increasing false positives. The underlying fitted model is unchanged.
“Clusters are natural categories discovered without judgment.”
Feature choice, scaling, distance, algorithm, number of clusters, and interpretation define the grouping. Different choices produce different clusters.
Mastery practice
Work the problem before opening the solution
Translate scores into decisions. Calculate error measures, account for capacity and consequence, and treat clusters as analytical groupings that require validation rather than natural facts.
Problem 1Applied
Calculate classification performance
confusion matrix
precision
recall
Scenario
Among 10,000 payments, a model flags 200. Review confirms 80 flagged payments are exceptions and 120 are normal. Of the 9,800 unflagged payments, later testing finds 20 exceptions and 9,780 normal payments.
Your work
Identify TP, FP, FN, and TN.
Calculate precision, recall, false-positive rate, and accuracy.
Explain why each measure answers a different accounting or operational question.
Need a starting hint?
Precision uses flagged cases as the denominator; recall uses all actual exceptions as the denominator.
Precision describes reviewer yield; recall describes exception coverage; false-positive rate describes disruption imposed on normal payments; accuracy describes overall correctness but is dominated by the many normal payments.
A decision also needs dollar severity, review cost, timing, subgroup effects, loss prevented, and comparison with the existing control. A high accuracy number alone can conceal 20 missed exceptions.
Problem 2Challenge
Choose a threshold under limited review capacity
thresholds
capacity
expected cost
Scenario
Threshold 0.80 flags 80 payments, finds 52 of 100 exceptions, and creates 28 false positives. Threshold 0.60 flags 220, finds 78 exceptions, and creates 142 false positives. Threshold 0.40 flags 600, finds 92 exceptions, and creates 508 false positives. Review capacity is 250 payments per week.
Your work
Calculate precision and recall at each threshold.
Recommend a threshold under the stated capacity and explain what additional information could change the choice.
Propose a control for payments beyond review capacity.
Need a starting hint?
A lower threshold usually raises recall and workload while lowering precision; it does not automatically improve the underlying model.
Reveal the worked solution
At 0.80, precision is 52/80 = 65% and recall is 52%. At 0.60, precision is 78/220 ≈ 35.5% and recall is 78%. At 0.40, precision is 92/600 ≈ 15.3% and recall is 92%.
Threshold 0.60 fits the 250-case capacity and captures more exceptions than 0.80, so it is a reasonable starting recommendation. The choice could change with exception dollar loss, review cost, payment urgency, score calibration, subgroup impacts, or the ability to prioritize within the flagged set.
Use risk-tiered actions: hold or escalate the highest-severity cases, sample lower-score cases, apply deterministic controls to unreviewed payments, monitor missed outcomes, and prevent the queue from silently truncating. Capacity must be part of the control design.
Problem 3Applied
Test whether predicted probabilities are calibrated
calibration
probability
decision use
Scenario
For 500 invoices assigned scores between 0.70 and 0.80, only 75 become confirmed exceptions. For 2,000 invoices scored between 0.20 and 0.30, 480 become confirmed exceptions.
Your work
Compare average observed outcomes with the score ranges.
Explain how poor calibration can affect provisions, staffing, or risk ranking even when ranking is useful.
Propose calibration and outcome-quality checks.
Need a starting hint?
A well-calibrated 0.75 group should have an outcome rate near 75%, subject to sampling variation and valid labels.
Reveal the worked solution
The high-score group's observed rate is 75/500 = 15%, far below 70–80%. The lower-score group's rate is 480/2,000 = 24%, roughly compatible with its range. The first result suggests severe miscalibration, label timing issues, population shift, or a score that was never intended as a literal probability.
Ranking can still place riskier cases earlier, but treating scores as probabilities would overstate expected exceptions in the high group, distort provisions or resource forecasts, and create misleading confidence.
Plot observed outcome by score band and period, compute calibration error and Brier score, check whether labels have matured and are consistent, inspect subgroup calibration, compare development and current populations, and recalibrate only with representative data and controlled validation.
Problem 4Challenge
Interpret a logistic-regression coefficient
log odds
odds ratio
cautious interpretation
Scenario
In a payment-exception logistic model, the coefficient on AfterHours is 0.693, where AfterHours equals 1 for payments initiated outside approved business hours. Other included variables are held constant.
Your work
Convert the coefficient to an odds ratio and interpret it.
Explain why this does not mean the probability doubles.
Identify reasons the coefficient should not be interpreted causally.
Need a starting hint?
The odds ratio is exp(0.693), approximately 2. Probability depends on both the baseline odds and all model inputs.
Reveal the worked solution
exp(0.693) ≈ 2. The estimated odds of an exception are twice as high for after-hours payments as for otherwise comparable in-hours payments under the fitted model.
Doubling odds does not double probability. If baseline probability is 10%, baseline odds are 0.10/0.90 = 0.111; doubled odds are 0.222, corresponding to probability 0.222/1.222 ≈ 18.2%, not 20%.
After-hours activity may proxy for geography, emergency processing, employee role, system batch timing, transaction type, or known risk-based review. Omitted variables, selection, measurement, and reverse process effects prevent a causal claim without stronger design.
Problem 5Applied
Prevent scale from dominating a clustering result
clustering
distance
scaling
Scenario
Vendors are clustered using annual spend ranging from $5,000 to $40 million, on-time rate from 0 to 1, average days to deliver from 1 to 60, and dispute count from 0 to 40. No scaling is applied. The resulting clusters almost entirely separate vendors by spend.
Your work
Explain why spend dominates common distance calculations.
Propose transformations and scaling choices, including their business implications.
Describe how to evaluate whether the clusters are useful and stable.
Need a starting hint?
Distance is sensitive to units. A one-dollar difference and a one-unit rate difference are not comparable without a deliberate transformation.
Reveal the worked solution
Spend differences are measured in millions while rates and days are at much smaller numeric scales, so squared or absolute distance is driven by spend even if other features matter operationally.
Consider log-transforming skewed spend, converting counts to exposure-adjusted rates, winsorizing only with justification, and standardizing features. Feature weights should reflect the decision; equal standardized weight is a choice, not a neutral truth. Preserve interpretable original values for cluster profiling.
Test multiple seeds, samples, periods, cluster counts, transformations, and feature sets; assess separation and stability; profile clusters on variables not used to create them; ask whether groups lead to distinct sourcing or control actions; and verify that small or sensitive subgroups are not misleadingly labeled.
Chapter review
Explain before revealing
Answer each question in your own words. Then open the explanation and compare the logic, not just the vocabulary.
01When is recall more important than precision?
When missing a true case is especially costly and the organization can tolerate or review more false alerts, subject to affected-party and capacity considerations.
02Why scale features before distance-based clustering?
A feature with numerically large units can dominate distance even when it is not more important, causing clusters to reflect measurement units rather than intended similarity.
03What makes a cluster useful?
It is reasonably stable, interpretable using independent facts, relevant to a real decision, actionable, and not dependent on inappropriate or harmful proxies.
Chapter 11
Part V · Generative AI
Generative AI and language-model foundations
A language model generates plausible sequences from learned patterns; reliability comes from the system built around it.
After this chapter, you should be able to
Explain tokens, next-token prediction, embeddings, attention, and context in plain language.
Distinguish model training from the information supplied during use.
Explain multimodal and reasoning-oriented systems without treating their output as self-validating.
Explain why confident language is not evidence of factual accuracy.
Identify accounting tasks that fit or do not fit generative models.
Chapter roadmap
Start with the question, then build the concept
The essential question
What does a language model actually do, and what must the surrounding system supply before accountants can rely on its output?
Fluent language can create an illusion of knowledge and evidence. Students need a durable mental model of tokens, training, context, retrieval, tools, multimodality, uncertainty, and verification rather than memorizing product names.
Before you begin
Distinguish a probabilistic prediction from an authoritative source or verified fact.
Recall that an AI product includes more than its underlying model.
Understand source, version, permission, lineage, and human accountability from earlier AIS chapters.
A productive reading sequence
Understand token-by-token generation, embeddings, attention, training, and context in plain language.
Separate pretraining and adaptation from information temporarily supplied during use.
Study how retrieval, multimodal inputs, reasoning-oriented computation, and deterministic tools extend the model.
Match model roles to tasks and require evidence, evaluation, documentation, and accountable review.
Concepts to hold onto
Token and next-token prediction
Text is represented as token units. The model repeatedly estimates likely next tokens from the current sequence, producing complex language through many conditional predictions.
Embedding and attention
Embeddings represent learned relationships as vectors. Attention combines information across the current context; neither mechanism guarantees factual truth or human understanding.
Context window
The limited working material available during generation, including instructions, conversation, retrieved evidence, tool results, and generated text.
Grounding
Connecting output to selected authoritative evidence or controlled tool results so material claims can be traced and verified.
Hallucination or confabulation
Fluent generation of unsupported or false content, which can include invented citations, facts, calculations, or explanations.
11.1
Generating one token at a time
A large language model processes text as tokens, which may be words, pieces of words, punctuation, or other symbols. Given a sequence of tokens, it estimates a probability distribution for what token could come next. It selects a token, adds it to the sequence, and repeats. Complex responses emerge from this repeated prediction process.
The model does not retrieve a complete answer from a hidden filing cabinet. Its parameters encode patterns learned during training. This enables flexible language, summarization, transformation, and reasoning-like behavior. It also explains why the model can produce fluent statements that are unsupported or false.
Generation settings influence variability. More deterministic settings favor high-probability continuations; more exploratory settings increase variation. Neither setting creates truth. Reliability depends on task design, evidence, tools, verification, and control.
Figure 11.1 · Model and system
The model generates language; the surrounding system supplies authority
01Authoritative sourcesPolicies, contracts, standards, and ledgers
02Context and retrievalSelect relevant, permitted evidence
03Language modelInterpret and generate candidate output
04Controls and reviewerValidate, approve, record, and remain accountable
Current AI products combine a probabilistic model with context, retrieval, tools, policies, logs, and human responsibility.
11.2
Embeddings and attention
Embeddings represent tokens or other items as vectors whose positions capture learned relationships. Similarity in this space can support search, classification, and retrieval. The representation is mathematical and contextual; it is not a dictionary definition or a guarantee that two items are equivalent for accounting purposes.
Attention allows the model to weigh relationships among tokens in the current context. It helps connect pronouns, instructions, examples, figures, and distant parts of a document. Attention is a mechanism for combining context, not a human spotlight or proof of comprehension.
In practice, embeddings can retrieve potentially relevant policy passages or group similar transactions. The retrieved items still require authorization, completeness, and interpretation. Similar wording may describe a different jurisdiction, period, or accounting policy.
Source figure · Transformer architecture
Attention operates inside a larger transformer architecture
This technical view is for orientation, not memorization. Follow the arrows to see how embeddings enter attention blocks, how residual connections preserve information, and how the system produces output probabilities.Image credit: dvgodoy. Source: Wikimedia Commons. Reuse terms: CC BY 4.0.
Figure 11.2 · Semantic retrieval
Embeddings help find related language; metadata keeps the result in scope
01User questionMeaning expressed in natural language
02EmbeddingQuestion represented as a vector
03Similarity searchFind semantically close passages
04Metadata filterEnforce entity, date, version, and access
05Reviewed evidenceReturn source passage with provenance
Similarity alone may retrieve an obsolete policy, wrong entity, or different jurisdiction, so semantic search and structured filters work together.
11.3
Training and adaptation
Pretraining exposes a model to large collections of data and teaches broad language patterns through prediction. Subsequent instruction tuning or other adaptation can make responses more useful for following requests. Preference-based methods can further shape behavior toward desired qualities.
Training is different from the prompt and documents supplied during a conversation. The model’s parameters usually do not change when a user adds a policy to the context. The model uses the temporary context to produce the current response. This distinction matters when organizations discuss updating, grounding, or retaining information.
Training data are imperfect, historically situated, and often difficult to inspect completely. Models can reproduce biases, outdated assumptions, or common misconceptions. An organization should not assume that general training contains its private policy or current authoritative guidance.
Figure 11.3 · Training, adaptation, and use
Model training and conversation context are different mechanisms
01PretrainingLearn broad statistical patterns from large datasets
02AdaptationTune instruction-following and preferred behavior
03Deployed modelParameters are fixed for a particular version
04Prompt and contextSupply temporary instructions and evidence
05ResponseGenerate output for the current interaction
Supplying a policy during use can ground one response without changing the model's learned parameters.Check your understandingDoes pasting a policy into a prompt train the model?
Not in the ordinary sense of changing its parameters. The policy becomes part of the current context. Separate product settings and provider terms determine whether interaction data may later be retained or used, so organizations should review those terms before entering sensitive information.
11.4
Context is limited working material
The context window contains the current instructions, conversation, retrieved material, and generated text that the model can use at one time. Longer context can include more evidence, but more is not always better. Irrelevant or conflicting documents can distract the model, and important details can be difficult to use consistently across very long inputs.
Good context construction selects authorized, relevant, and current material; preserves useful structure; and tells the model how to handle conflicts and missing evidence. Chunking a document can improve retrieval but may separate a sentence from definitions, exceptions, or tables that determine its meaning.
The system should distinguish model context from authoritative storage. A chat transcript is not automatically an accounting workpaper, records repository, or approved decision log. Required evidence and approvals should be stored in controlled systems.
Figure 11.4 · What enters the context window
The model works from selected material, not the organization's entire knowledge base
01System instructionsRole, policies, priorities, and behavioral limits
02ConversationCurrent request and relevant prior turns
03Retrieved evidenceSelected passages, metadata, and source identifiers
04Tool resultsDatabase rows, calculations, search, or application state
05Generated tokensThe developing answer also consumes context
Instructions, user input, retrieved passages, tool results, and generated text compete for limited working context.
11.5
Multimodal and reasoning-oriented systems
Contemporary generative systems may accept several forms of input: text, images, audio, spreadsheets, diagrams, and combinations of them. Multimodal capability matters in accounting because evidence rarely arrives as clean paragraphs. An invoice has layout, a lease contains tables, a warehouse photograph contains visual evidence, and a meeting recording contains spoken statements. A system may connect these modes, but each mode introduces its own extraction and interpretation errors.
Reasoning-oriented models use additional computation during response generation to work through multi-step tasks. They may plan intermediate steps, test candidate approaches, use tools, or revise an answer before presenting it. This can improve performance on difficult analysis, code, and mathematics. It does not turn the response into an audit trail or guarantee that the reasoning used all relevant evidence. The visible explanation may be a useful summary without being a complete record of the model's internal computation.
For accountants, the practical question is what evidence entered the system and what controlled operation produced each material result. If a model reads an invoice image, preserve the original image, extracted fields, confidence or exception indicators, validation results, and reviewer changes. If a reasoning model uses a calculator or database, preserve the tool call and result rather than relying only on the final prose.
Figure 11.5 · Multimodal evidence
Each input mode needs its own validation path
01Document imageValidate OCR, layout, handwriting, and low-confidence fields
02Text and tablesPreserve definitions, structure, exceptions, and versions
03AudioValidate speaker, transcription, timing, and consent
04Tool resultPreserve parameters, source, calculation, and returned value
Combining text, images, audio, and calculations can improve coverage while also combining their distinct extraction and interpretation errors.Check your understandingWhy is a polished step-by-step explanation not sufficient evidence that a reasoning model reached the correct conclusion?
The explanation may omit errors, unused evidence, or internal operations. Verify material claims against authorized sources and preserve controlled tool results, inputs, versions, and reviewer decisions.
11.6
Match the model to the task
Language models are well suited to drafting, summarizing, classifying text, extracting candidate fields, explaining concepts, and transforming formats when outputs can be reviewed. They are less appropriate as the sole authority for exact calculations, current rules, irreversible actions, or conclusions requiring complete and verifiable evidence.
Many useful workflows combine deterministic systems and generative models. A database calculates balances, a rule engine enforces authorization, a retrieval service supplies policies, and a language model drafts an explanation. The model contributes flexibility while controlled components preserve exactness.
Task decomposition often improves reliability. Instead of asking for a complete technical accounting memo in one step, the system can identify relevant facts, retrieve approved guidance, map facts to criteria, draft the analysis, check citations, and route the result to a qualified reviewer.
Figure 11.6 · Match the component to the task
Use generative models for flexible language and controlled systems for exact execution
01Draft or summarizeModel proposes language; reviewer verifies claims
02Retrieve evidenceSearch service enforces permissions and returns sources
03Calculate amountDeterministic code computes and reconciles
04Classify exceptionModel or rule suggests; workflow handles confidence
05Approve decisionAuthorized person applies defined review criteria
06Post transactionControlled application validates and records the action
Many reliable accounting applications combine both rather than asking one model to perform every step.
Illustrative task fit
Task
Potential model role
Required control
Summarize a vendor contract
Draft clause summary
Link each claim to reviewed source text
Calculate depreciation
Explain method or generate template
Deterministic calculation and reconciliation
Classify expense descriptions
Suggest category
Confidence handling and reviewer override
Release a payment
Explain exception evidence
Authorized deterministic workflow; model cannot release alone
11.7
Separate the model from the AI system
A model is one component. A deployed AI system may also include system instructions, retrieval indexes, access rules, tools, memory, application code, user interfaces, monitoring, and human review. Two products using the same underlying model can therefore behave very differently. One may search an approved policy library and show citations; another may answer from general patterns with no source control.
This distinction makes evaluation more durable. Model rankings change quickly, but accountants can continue asking stable system questions: What is the authorized source? Which user identity and permissions apply? What may the system change? How are versions and actions logged? How is insufficient evidence handled? Who reviews the output and owns the final decision?
It also helps assign responsibility. A provider may develop a general model, a software vendor may create the application, and Northstar may select the data, configure permissions, and decide how output affects an employee or customer. Governance should attach controls and accountability to each layer instead of describing every failure as 'the AI made a mistake.'
Source figure · Retrieval-augmented generation
RAG is a system around a language model, not a fact stored inside it
The diagram separates retrieval from generation. The model receives selected passages at runtime; the application still must enforce document permissions, version control, provenance, citation checks, and a safe response when retrieval finds insufficient evidence.Image credit: Turtlecrown. Source: Wikimedia Commons. Reuse terms: CC BY-SA 4.0.
Figure 11.7 · Model inside the deployed system
The same model can produce very different risk in different systems
01OrganizationPurpose, policy, owner, accountability, and consequences
02ApplicationInterface, access, workflow, validation, logging, and monitoring
03Tools and dataRetrieval, databases, calculators, files, and actions
04ContextInstructions, conversation, retrieved passages, and tool results
05ModelProbabilistic component that interprets and generates
Reliability depends on the surrounding data, tools, permissions, validations, interface, records, monitoring, and human process.
Model layer: learned parameters and inference behavior.
Context layer: instructions, conversation, retrieved documents, and temporary working material.
Tool layer: databases, calculators, search, files, and external actions.
Application layer: permissions, interface, validations, logging, and workflow rules.
Organization layer: purpose, policy, review, accountability, monitoring, and consequences.
11.8
Fluency, uncertainty, and evidence
Language models are optimized to produce likely continuations, not to communicate calibrated uncertainty automatically. A response can sound equally confident when it is supported, uncertain, or invented. Asking the model to be careful may improve behavior, but it is not a control equivalent to evidence.
Grounded systems make source material available and require output to connect claims to that material. Evaluation tests whether citations actually support claims, whether important evidence was omitted, and whether the system appropriately declines when evidence is insufficient.
Accountants should treat model output as a work product with provenance. Record the model or system version where relevant, prompt or instructions, source documents, key parameters, reviewer, changes, and final decision. The level of documentation should match the significance of the use.
Figure 11.8 · From generated claim to usable evidence
Fluent output becomes work product only after verification
01Generated claimCandidate language, not self-proving evidence
02Cited sourceLocate the exact authorized passage or data
03Support testDoes the source actually justify this claim?
04Completeness testWere exceptions and contrary evidence considered?
05Reviewed conclusionQualified person approves, changes, or rejects
The strongest workflow tests each material claim against an authorized source and records the reviewer’s final conclusion.Check your understandingWhat is the strongest response when the approved sources do not support a conclusion?
State that the evidence is insufficient, identify what is missing, and escalate or obtain additional authoritative material. Generating a plausible completion is not an acceptable substitute.
Worked case
Evaluate an AI-generated lease-accounting memo
A manager uploads a lease and asks a general AI assistant to determine classification and provide exact authoritative paragraph citations. The response is polished, states a conclusion confidently, and cites several paragraph numbers.
Identify what the model had access to
Confirm whether the system received the complete lease, amendments, relevant accounting standard, entity policy, effective dates, and jurisdiction. General training does not establish access to current authorized guidance.
Separate extraction from judgment
First extract candidate facts such as term, payments, options, residual guarantees, asset life, and transfer provisions, with page citations. Have a reviewer confirm completeness before applying classification criteria.
Ground the analysis
Retrieve approved standard and policy passages under version and access controls. Require every criterion and conclusion to link to lease evidence and authoritative text. Verify that cited passages actually support the claim.
Use deterministic tools for exact work
Calculate payment schedules, present values, dates, and journal-entry amounts with controlled code or spreadsheets that reconcile. The model can explain results but should not hide arithmetic in prose.
Document review and uncertainty
Record system version, instructions, sources, tool outputs, reviewer changes, unresolved facts, consultation, and final authorized conclusion. If evidence is insufficient, the correct response is to identify what is missing.
What the case establishes
The assistant can accelerate extraction and drafting, but the memo becomes usable only through complete evidence, authoritative grounding, deterministic calculation, and qualified review.
Common misconceptions
Ideas that sound plausible—but need correction
“The model searches its training data for the answer.”
Its parameters encode learned statistical patterns. Retrieval from a specific document collection is a separate system component that must be configured and governed.
“A longer context window means the model uses every included fact correctly.”
Long context permits more material but can also include irrelevant, conflicting, poorly structured, or hard-to-use evidence. Selection and evaluation remain necessary.
“Reasoning models prove their conclusions through step-by-step explanations.”
A displayed explanation is generated output, not a complete audit trail. Material claims and tool operations still require independent evidence and verification.
“Pasting a policy into a prompt trains the model.”
It ordinarily supplies temporary context for the current interaction. Training changes parameters through a separate process.
Mastery practice
Work the problem before opening the solution
Distinguish the language model from the complete application and control environment. Treat generated text as a claim requiring evidence, not as evidence about the underlying accounting facts.
Problem 1Foundation
Draw the boundary between model and system
model versus system
controls
accountability
Scenario
An accounts-payable assistant accepts invoice PDFs, extracts fields with OCR, retrieves purchase orders, asks a language model to explain mismatches, displays a recommendation, and lets a clerk release or hold the invoice. Logs are stored for 30 days.
Your work
Identify which components are the model and which belong to the surrounding system.
Map at least one failure and control at input, retrieval, model, interface, human-review, action, and logging stages.
Explain why testing the model alone cannot establish that the AP assistant is reliable.
Need a starting hint?
The model produces text or structured output; permissions, documents, interfaces, deterministic rules, user decisions, and records determine what that output can affect.
Reveal the worked solution
The language model is one component. OCR, document storage, retrieval, matching logic, prompts, interface, user authentication, release permissions, workflow, and logs form the deployed system.
Controls could include file validation, trusted-source retrieval, access filters, source citations, schema validation, deterministic amount checks, uncertainty display, independent approval for release, least privilege, immutable action logs, and retention aligned with audit and policy needs. Each addresses a different failure mode.
A strong model can still receive the wrong invoice, retrieve another vendor's order, use stale policy, produce output that the interface mis-parses, encourage automation bias, or trigger an unauthorized payment. System-level performance and control evidence are therefore required.
Problem 2Applied
Reason about tokens and context limits
tokens
context window
document strategy
Scenario
A team pastes a 180-page revenue policy, 60 contracts, email correspondence, and a spreadsheet export into one prompt. The model returns a confident two-page memo but does not mention a contract amendment on page 47 of one attachment.
Your work
Explain why fitting material into a context window does not guarantee equal attention or correct use.
Design a more reliable document-selection and analysis strategy.
Specify evidence the final memo should expose to its reviewer.
Need a starting hint?
Context capacity is not proof of retrieval, relevance, comprehension, or faithful citation.
Reveal the worked solution
Documents are converted into tokens, may be truncated or transformed, and compete for attention. Relevant language can be buried, duplicated, contradictory, or poorly extracted. A confident output does not reveal which evidence influenced it.
Create a complete document inventory; identify governing agreements and amendments; preserve hierarchy and dates; extract and verify text; retrieve focused passages for each accounting question; require the system to distinguish missing from irrelevant evidence; use deterministic tools for calculations; and route material judgments to qualified review.
The memo should link each factual and accounting claim to exact source documents and locations, identify amendments, disclose absent or conflicting evidence, show calculations and assumptions, state model and prompt version where relevant, and retain the reviewed output and approval record.
Problem 3Applied
Investigate a plausible hallucination
hallucination
verification
accounting evidence
Scenario
A model states that a lease contains a bargain-purchase option and quotes a sentence that sounds contractual. The uploaded agreement has no search hit for the quotation, but a draft term sheet contains similar language.
Your work
Classify possible failure modes rather than assuming a single cause.
Define immediate actions before the conclusion enters an accounting memo.
Recommend system changes that reduce recurrence and improve detection.
Need a starting hint?
The output may combine a draft, retrieve the wrong source, fabricate language, or mis-handle document versioning. All require source-level verification.
Reveal the worked solution
Possible causes include retrieval of the draft rather than executed agreement, faulty version metadata, cross-document blending, fabricated quotation, OCR error, or a prompt that failed to restrict sources.
Stop reliance, inspect the executed agreement and amendments, verify document authority and completeness, trace retrieval logs and citation IDs, correct the factual record, assess whether prior outputs used the same claim, and have the accounting conclusion reperformed by a qualified reviewer.
Separate drafts from executed documents, enforce source hierarchy and permissions, require extractive quotations with page-level provenance, validate quotations against retrieved text, label uncertainty, block unsupported citations, retain retrieval traces, test adversarial version-conflict cases, and monitor unsupported-claim rates.
Problem 4Challenge
Use embeddings without confusing similarity with truth
embeddings
semantic retrieval
source authority
Scenario
A semantic search for ‘customer control transfer’ retrieves an old training slide, a current revenue policy, a superseded policy, and a customer email. The old slide ranks first by similarity.
Your work
Explain what the embedding-based ranking does and does not establish.
Design retrieval rules that combine similarity with authority, date, permissions, and document type.
Describe a test set for evaluating the retrieval layer.
Need a starting hint?
Semantic closeness is about representation in vector space. It is not an opinion on which document governs the accounting conclusion.
Reveal the worked solution
The ranking suggests that the old slide is semantically close to the query. It does not establish that the slide is current, authorized, complete, applicable, or correct.
Filter by user permission and approved corpus; identify effective and superseded versions; boost executed contracts and current policies; preserve customer evidence without treating it as policy; retrieve a diverse set of passages; display document type and effective date; and require explicit handling of conflicts.
Build representative questions with expected authoritative documents and relevant passages, plus cases involving synonyms, amendments, tables, negation, superseded policies, access restrictions, absent evidence, and conflicting sources. Measure recall of required sources, inappropriate retrieval, citation correctness, and downstream answer quality.
Problem 5Challenge
Allocate work between AI, deterministic tools, and people
task decomposition
grounding
human judgment
Scenario
Northstar wants an AI workflow to prepare a revenue-recognition memo from 400 contracts. The proposed system lets the model extract terms, calculate allocation percentages, determine recognition timing, draft the memo, and post entries after manager approval.
Your work
Decompose the workflow and allocate each task to a model, deterministic code, or qualified person.
Identify checkpoints and evidence at each handoff.
Recommend a bounded first deployment and an explicit non-goal.
Need a starting hint?
Language models are useful for unstructured extraction and drafting; deterministic tools are stronger for repeatable arithmetic and rules; accountable people resolve ambiguous judgments and authorize entries.
Reveal the worked solution
A model can propose contract clauses and draft explanations with citations. Deterministic code should calculate allocations, dates, and reconciliations from approved structured fields. Qualified accountants should validate contract completeness, resolve modifications and ambiguous obligations, approve policies and judgments, and authorize entries through normal controls.
Handoffs should retain document version, extracted field and citation, reviewer correction, approved structured record, calculation inputs and output, exception status, memo version, accounting approval, and posting reference. Failed or uncertain extraction should not silently become calculation input.
Begin with read-only extraction and memo drafting for a representative sample, with no autonomous conclusion or posting. Measure field accuracy, citation support, review time, correction type, and missed clauses against a baseline. A clear non-goal is allowing the model to post or approve revenue entries.
Chapter review
Explain before revealing
Answer each question in your own words. Then open the explanation and compare the logic, not just the vocabulary.
01Why can a model invent a plausible citation?
It learned linguistic patterns of professional citations and can generate a likely-looking continuation even without access to or verification against the authoritative source.
02What is the difference between a model and an AI system?
The model is the probabilistic component. The system also includes instructions, data, retrieval, tools, memory, permissions, application logic, interface, records, monitoring, and people.
03Which accounting tasks are poor candidates for an unreviewed language model?
Exact calculations, current-rule conclusions, complete-population assertions, irreversible actions, and consequential decisions requiring authoritative and verifiable evidence.
Current AI landscape
Further reading and primary sources
AI products, standards, and legal requirements change quickly; follow the linked source for the current version and requirements.
U.S. National Institute of Standards and Technology
A practical distinction between predetermined workflows and systems that dynamically direct their own tool use.
Chapter 12
Part V · Generative AI
Prompting, grounding, and AI workflows
A good prompt clarifies the job; a good system controls the evidence, tools, evaluation, and action around the model.
After this chapter, you should be able to
Write prompts with purpose, context, constraints, evidence, and output criteria.
Explain retrieval, tools, and structured outputs as workflow components.
Distinguish a predetermined AI workflow from an agent that dynamically selects steps and tools.
Apply identity, least privilege, approval, tracing, and stop conditions to agentic workflows.
Evaluate a generative system using representative cases and claim-level evidence.
Design human review that can meaningfully change the outcome.
Chapter roadmap
Start with the question, then build the concept
The essential question
How do we design an AI-assisted workflow whose evidence, permissions, tools, actions, and review remain controlled?
Prompting is only one layer. Reliable use depends on source governance, retrieval, identity, least privilege, structured outputs, deterministic validation, evaluation, approval gates, traces, budgets, and stop conditions.
Before you begin
Understand language-model generation, grounding, context, tools, and model-system distinction.
Recall least privilege, segregation, validation, audit trail, and change control.
Distinguish a draft or recommendation from an authorized transaction or final professional conclusion.
A productive reading sequence
Write a testable task specification with purpose, evidence, constraints, output, and missing-information behavior.
Build retrieval and tool access under the initiating user's permissions and validate every consequential operation.
Evaluate representative cases and design human review that can understand and change outcomes.
Concepts to hold onto
Retrieval-augmented generation
A pipeline that searches an approved collection, supplies selected passages to the model, and generates a response that should remain traceable to those sources.
Structured output
Output constrained to defined fields or a schema so software can validate format and route values; valid structure does not guarantee correct content.
Workflow versus agent
A workflow follows a largely predetermined sequence. An agent dynamically selects steps and tools within granted constraints based on intermediate results.
Delegated authority
A bounded grant allowing software to act for an identified user or organization for a defined purpose, scope, duration, and set of tools.
Human oversight
Review by a person with competence, evidence, criteria, time, authority, incentives, and a practical ability to challenge or change the outcome.
12.1
Make the task observable
A useful prompt identifies the role or perspective, objective, audience, relevant facts, authorized sources, constraints, and desired output. It also states what to do when evidence is missing or conflicting. The goal is not elaborate wording; it is a testable job description.
Separate instructions from data. Clearly delimit a contract, policy, email, or ledger extract so text inside the source is not mistaken for a system instruction. Specify whether the model may use general knowledge or only supplied evidence. For consequential work, require source links or citations at the claim level.
Output criteria make review easier. A request for a concise memo should define the sections, decision standard, tables, and uncertainty disclosures. Structured output can support downstream validation, but a valid format does not ensure correct content.
Figure 12.1 · Anatomy of a controlled prompt
A useful prompt makes the task and review criteria observable
01Purpose and audienceState the decision and intended reader
02Facts and sourcesProvide authorized evidence and delimit source text
03ConstraintsDefine scope, prohibited actions, and uncertainty handling
04Output structureSpecify fields, sections, citations, and format
05Review criteriaExplain how support, completeness, and accuracy will be tested
Prompt quality comes from a clear work specification, not from decorative wording or pretending the model has professional authority.
12.2
Examples teach the pattern in context
Few-shot prompting provides examples of inputs and desired outputs. Examples can clarify labels, tone, reasoning structure, and edge cases without changing model parameters. Their wording and order can influence the response, so examples should be representative and reviewed.
Examples can also introduce bias. If every high-risk example involves a new vendor, the model may overuse that feature even when other evidence matters. Include difficult negative examples, exceptions, and cases where the correct response is insufficient information.
Do not include confidential real records casually. Use authorized, minimized, or synthetic examples consistent with organizational policy. Treat prompts and example libraries as controlled content when they shape important decisions.
Figure 12.2 · What examples teach
Examples define a pattern by showing both ordinary and boundary cases
01Positive exampleShows when the target label or format applies
02Contrast caseShows a similar input with a different correct result
03Edge caseShows how exceptions and unusual facts are handled
04Insufficient evidenceShows when the system should decline or escalate
A balanced example set includes positive cases, negative cases, exceptions, and situations where evidence is insufficient.
12.3
Ground the response in controlled evidence
Retrieval-augmented generation searches an approved collection and supplies relevant passages to the model. It can improve currency and traceability without retraining the model. The system still depends on collection completeness, document permissions, metadata, retrieval quality, and the model’s use of passages.
Retrieval should enforce access before content reaches the model. A user who cannot open a compensation file should not receive its content through an AI answer. Effective dates, jurisdictions, versions, and document types help restrict search to authoritative material.
Citations must be verified. A response may cite a relevant passage that does not support the particular claim, or combine several passages into an unsupported conclusion. Evaluation should test both retrieval recall and claim-to-source support.
Figure 12.3 · Retrieval-augmented generation
Grounding is a pipeline, not a promise in the prompt
01Approved collectionCurrent, complete, versioned, and permissioned
02RetrieveSearch with semantic and metadata criteria
03Construct contextInclude relevant passages and source identifiers
04GenerateDraft claims linked to supplied evidence
05VerifyTest claim support, omissions, and authority
The system must govern the source collection, permissions, retrieval, citations, and human use of the generated response.
12.4
Tools give the model a path to data and action
A model can be connected to tools that query databases, perform calculations, retrieve documents, or initiate workflows. Tool use can improve exactness, but it also expands risk. The model’s request should be validated by deterministic code, permissions should follow the user, and high-impact actions should require explicit approval.
Separate read from write. A system that summarizes receivables needs read access; it does not need authority to change customer status. If an action is useful, create a narrow tool with allowed parameters, validation, logging, and confirmation rather than giving broad system access.
Treat tool outputs as evidence with provenance. Record the query, parameters, source, run time, returned identifiers, and any transformations. A model’s narrative should not obscure the controlled calculation or transaction underneath.
Figure 12.4 · Controlled agent loop
An agent repeatedly observes, decides, uses a tool, and checks the result
01ObserveRead the request and permitted state
02PlanChoose the next bounded step
03Call toolUse approved capability with narrow parameters
04ValidateCheck result, authority, and stop condition
05RecordPreserve trace and route approval
Identity, least privilege, validation, approval gates, and logs must surround the loop—especially when a tool can change external records.
12.5
Workflows and agents make different control choices
An AI workflow follows a substantially predetermined sequence: retrieve the policy, extract fields, calculate an amount, draft a memo, and route it for review. An agent receives an objective and dynamically decides which steps or tools to use based on intermediate results. Both may use language models and tools, but the agent has more discretion over the path.
Dynamic planning can help when the number and order of steps cannot be known in advance. An agent investigating an account variance might query the ledger, inspect supporting invoices, compare prior periods, and request another document only when evidence conflicts. The same flexibility enlarges the space of possible actions, errors, costs, and attacks. Use the least autonomy that the task genuinely requires.
Autonomy is not one switch. Designers choose what the system may read, which tools it may call, how many steps it may take, how much it may spend, which conditions require approval, and what it may change. A read-only research agent with a ten-step limit is a different risk from an agent that can email vendors and edit master data.
02Workflow controlExpected states and transitions are defined in advance
03Agent pathObserve → choose tool → inspect result → choose next step
04Agent controlBound tools, budgets, approvals, logs, and stop conditions
A workflow follows a designed path; an agent chooses among permitted steps based on intermediate results.
Workflow and agent comparison
Design question
Predetermined workflow
Agentic system
Path
Designed in advance
Chosen dynamically within constraints
Best fit
Stable, repeatable process
Variable task requiring adaptive search or planning
Primary control advantage
Expected states are easier to test
Can respond to unanticipated evidence
Primary control challenge
Brittle when exceptions differ
Larger and less predictable action space
Default accounting posture
Prefer when it can perform the task
Use bounded authority, trace, and approval gates
12.6
Identity, authority, and tool protocols
By 2026, agent identity and authority have become a central standards question. A system should distinguish the human user, the software agent acting for that user, the service being called, and the accountable organization. Authentication answers who or what is present. Authorization answers what that identity may do in this context. Delegation should be narrow, time-bounded where possible, and visible in logs.
Open connection protocols can standardize how AI applications discover and call tools or retrieve context. The Model Context Protocol is one current example. Standardization can reduce custom integration work, but a successful connection is not proof that the tool is appropriate, the data are authorized, or the result is correct. The host application still must enforce permissions, validate parameters, manage secrets, and record material actions.
Non-repudiation and provenance matter when an agent changes external state. A useful trace identifies the initiating user, agent and application version, delegated authority, tool and parameters, returned result, approval, final action, and timestamp. Logging sensitive data without limits creates a separate privacy and security problem, so logs need classification, access, retention, and integrity controls.
Source figure · AI actors across the lifecycle
An AI system distributes work across many actors and control boundaries
Use the lifecycle columns to ask who designs, validates, deploys, operates, audits, and is affected by the system. For an accounting agent, the initiating user, application owner, model provider, tool owner, reviewer, and affected party may sit in different columns and still share responsibility.Image credit: National Institute of Standards and Technology. Source: NIST AI RMF 1.0, Figure 3. Reuse terms: NIST-created U.S. government work.
Figure 12.6 · Delegated agent authority
A tool call should preserve who initiated it and what was delegated
01Human userInitiates the task under a known organizational identity
02AI applicationInterprets the request and holds the approved workflow
03Software agentActs within delegated purpose, scope, time, and budget
04Tool serviceAuthenticates the caller and validates allowed operation
05Audit recordLinks user, agent, tool, parameters, result, approval, and time
Connection protocols can standardize messages, but the host system must still authenticate identities and enforce business permissions.Check your understandingWhat does an interoperability protocol solve—and what does it not solve?
It can standardize connection and message patterns. It does not by itself establish business purpose, user authority, least privilege, evidence quality, correct output, or approval for a consequential action.
12.7
Long-running work needs budgets, checkpoints, and stop conditions
Some agentic tasks continue across many tool calls or wait for external events. A long-running investigation might collect documents, run analyses, pause for an employee response, and resume later. Background execution changes the control environment because the initiating user is no longer watching each step and the world may change between steps.
Define budgets for time, tokens, tool calls, data volume, and money. Use checkpoints before the system expands scope or performs a high-impact action. Make operations idempotent where possible so a retry does not create a duplicate journal entry, payment, or message. Store state in a controlled application rather than relying on a model's conversational memory.
Stop conditions are business rules, not merely technical timeouts. Stop when required evidence is missing, permissions change, contradictory amounts cannot be reconciled, an action exceeds materiality, a source attempts to redirect instructions, or a reviewer is required. The safest successful outcome may be a documented handoff rather than a completed automated task.
Figure 12.7 · Long-running agent control loop
Autonomous work should advance through recoverable checkpoints
01Start with budgetLimit time, cost, steps, data, and tools
02Perform bounded stepUse one permitted action with validated parameters
03Save checkpointPreserve state, sources, outputs, and decisions
04Test conditionsContinue, request approval, escalate, or stop
05Complete or hand offProduce a traceable result or safe unresolved case
Budgets and stop conditions prevent a background task from expanding scope or continuing after evidence, permissions, or circumstances change.
Budget: maximum time, cost, steps, and data access.
Checkpoint: a recoverable saved state with sufficient provenance.
Approval gate: a point where a qualified person must authorize continuation or action.
Idempotence: retrying an operation does not create a second unintended effect.
Stop condition: a defined event that ends automation and triggers fallback or escalation.
12.8
Evaluate the task, not the demo
A compelling demonstration shows possibility, not reliability. Evaluation uses representative cases, difficult edge cases, known failures, and unacceptable outcomes. Test factual support, completeness, instruction following, citation quality, formatting, safety, consistency, latency, and cost as relevant.
Create a test set independent of prompt development where possible. If developers repeatedly tune against the same examples, performance on those examples becomes optimistic. Qualified subject-matter reviewers should define rubrics and inspect disagreements, not only assign one overall score.
Generative outputs allow many acceptable phrasings, so evaluation may combine deterministic checks, model-assisted grading, and human review. Automated grading itself must be validated. A system should not grade its own work without independent evidence.
Figure 12.8 · Generative-system evaluation
Evaluate several dimensions because one average score hides material failures
01SupportAre material claims backed by authorized evidence?
02CompletenessAre relevant facts, exceptions, and counterevidence addressed?
03Instruction followingDid the system respect scope, format, and prohibitions?
04CalculationDo controlled amounts reconcile?
05Safety and authorityWere access and actions appropriately bounded?
06Workflow outcomeDid quality, time, cost, and reviewer burden improve?
The evaluation set should include representative work, difficult edges, historical failures, and explicitly unacceptable outcomes.
Illustrative memo-evaluation rubric
Dimension
Question
Failure example
Support
Is each conclusion supported by an approved source?
Invented or irrelevant citation
Completeness
Are material facts and counterevidence addressed?
Omitted termination clause
Calculation
Do amounts reconcile to controlled logic?
Model performs arithmetic in prose
Uncertainty
Are missing facts identified?
Assumption presented as fact
Action
Does output remain within authority?
Draft tool initiates payment
12.9
Human oversight must be consequential
A human in the loop is meaningful only when the reviewer has time, competence, evidence, authority, and incentives to challenge the system. A required click on hundreds of persuasive outputs can become automation bias rather than oversight.
Design the interface to support disagreement. Show sources and uncertainties, not only a polished answer. Require reasons for overrides where appropriate, but do not make correction burdensome. Feed reviewed outcomes into monitoring without assuming every human decision is correct.
Assign final accountability clearly. If a tax manager approves an AI-assisted memo, the organization should know what the manager is expected to verify and what controls support that verification. Responsibility cannot be delegated to the model.
Figure 12.9 · Consequential human review
A reviewer must be able to understand, challenge, and change the outcome
01See sourcesAccess original evidence and system limitations
02Apply criteriaUse a defined professional or organizational standard
03ChallengeInvestigate omissions, contradictions, and uncertainty
04Change outcomeEdit, reject, escalate, or request more evidence
05DocumentRecord reviewer, basis, changes, and final accountability
A required approval click is weak oversight when the reviewer lacks evidence, competence, time, authority, or a practical way to disagree.Check your understandingWhat makes AI review stronger than an approval button?
A defined reviewer with relevant expertise, access to source evidence, clear review criteria, manageable workload, authority to change or reject the output, and retained documentation of the conclusion.
Worked case
Design a controlled AI assistant for expense-policy review
Northstar wants an assistant to review employee expense reports against current travel policy, summarize potential exceptions, and reduce reviewer time. It must not determine fraud, reject reimbursement, or change the expense system.
Specify the bounded task
Define one output row per potential exception with claim ID, amount, policy section, quoted evidence, source link, uncertainty, and reviewer question. Require policy not found when evidence is absent.
Control sources and permissions
Retrieve only current approved policies for the employee's entity and jurisdiction. Enforce access before content reaches the model, preserve policy version and effective date, and treat text inside receipts or documents as untrusted data.
Separate model and deterministic work
Use code to reconcile totals, dates, currency conversion, thresholds, duplicate claim IDs, and required fields. Use the model to interpret descriptions and draft evidence-linked exception summaries.
Evaluate before deployment
Test ordinary claims, difficult exceptions, policy silence, wrong-entity documents, prompt injection, missing receipts, known historical failures, and protected or sensitive information. Measure support, completeness, false alerts, misses, review time, and correction.
Design consequential review and records
Show source documents, policy passages, calculations, and uncertainty. Let the reviewer edit, reject, or escalate. Retain system version, sources, output, reviewer decision, changes, final action, and monitored outcomes.
What the case establishes
The controlled product is not a clever prompt. It is a read-only evidence workflow with narrow purpose, verified sources, exact calculations, meaningful review, evaluation, and retained provenance.
Common misconceptions
Ideas that sound plausible—but need correction
“A detailed prompt is a sufficient control.”
Instructions influence output but do not enforce permissions, source completeness, exact calculation, authorized action, monitoring, or independent review.
“Citations guarantee grounding.”
A citation can point to an irrelevant or insufficient passage. Claim-level support and omitted evidence must be evaluated.
“An interoperability protocol makes agent tools safe.”
A protocol standardizes connection. The host and service still must authenticate, authorize, validate, minimize, log, and approve operations.
“Putting a human in the loop transfers responsibility to the reviewer.”
The organization must design a review the person can perform and retain accountability across provider, application, data, workflow, and management decisions.
Mastery practice
Work the problem before opening the solution
Design the workflow around evidence, permissions, structured handoffs, and evaluation. A more detailed prompt can improve instructions, but it cannot substitute for system controls or authoritative data.
Problem 1Foundation
Repair an under-specified accounting prompt
prompt design
scope
output criteria
Scenario
A user prompts: ‘Review these expenses and tell me which are wrong.’ The attachments contain 2,000 expense lines and a 35-page policy.
Your work
Identify missing task, population, policy, evidence, output, and uncertainty instructions.
Write a stronger prompt for a read-only first-pass review.
Name important controls that must exist outside the prompt.
Need a starting hint?
Specify the role as a bounded task, not an identity. Define allowed sources, exception criteria, required evidence, abstention behavior, and structured output.
Reveal the worked solution
The prompt does not define wrong, approved policy version, expense period, fields, duplicates, thresholds, exceptions, materiality, desired output, or how to handle missing evidence. It also implies a conclusion rather than a screening task.
A stronger prompt would instruct the model to screen the supplied population against the named effective policy only; produce one structured row per candidate with record ID, policy rule, cited passage, observed evidence, missing evidence, reason, and confidence; avoid deciding reimbursement; state ‘insufficient evidence’ when necessary; and summarize reconciliation counts.
External controls include access and privacy restrictions, complete file ingestion, authoritative-policy versioning, deterministic duplicate and amount checks, schema validation, human review, prohibited actions, logging, evaluation, and retention. Prompt text cannot enforce these by itself.
Problem 2Applied
Design retrieval-augmented policy guidance
RAG
citations
source hierarchy
Scenario
An employee asks whether a client dinner is reimbursable. Available sources include a current travel policy, an old FAQ, a regional exception, a manager email, and a receipt. The RAG system retrieves all five.
Your work
Define the authority and applicability rules the workflow should use.
Specify the answer structure and abstention conditions.
Create tests for conflicts, missing receipts, regional differences, and superseded guidance.
Need a starting hint?
Retrieval makes text available; the workflow still needs rules for which source governs and whether the case contains enough evidence.
Reveal the worked solution
Use permissions, effective dates, employee region, policy hierarchy, and approved-exception metadata. Current policy governs unless an applicable authorized exception modifies it. The email may document approval but should not silently rewrite policy; the receipt is transaction evidence, not policy.
Return eligibility status such as supported, not supported, or needs review; applicable rule with exact citation; relevant facts; missing evidence; exception status; and next action. Abstain when region, attendees, business purpose, approval, receipt, or source authority is unresolved.
Tests should include conflicting old and new text, an exception that applies only to one region, a receipt without business purpose, a manager email contradicting policy, no authoritative source, prompt injection inside a receipt, and permission-restricted guidance. Evaluate both answer correctness and source selection.
Problem 3Applied
Validate structured output before system use
structured output
schema validation
deterministic checks
Scenario
A model extracts invoice data into JSON with fields VendorID, InvoiceNumber, InvoiceDate, Currency, NetAmount, TaxAmount, GrossAmount, PurchaseOrderID, and Confidence. The next step automatically creates an invoice record.
Your work
Define schema and business-rule validations before creation.
Distinguish syntax validity, field validity, cross-field validity, and source support.
Design exception handling that avoids both silent acceptance and endless manual review.
Need a starting hint?
Valid JSON can contain a nonexistent vendor, impossible date, unsupported amount, or mathematically inconsistent total.
Reveal the worked solution
Validate required fields, data types, formats, allowed currencies, date ranges, decimal precision, known active vendor and purchase order, duplicate invoice key, and field length. Check NetAmount + TaxAmount = GrossAmount within tolerance and reconcile lines when available.
Syntax validity means parsable JSON; field validity means each value meets rules; cross-field validity means values agree with one another and related master data; source support means each value traces to the actual invoice or approved reference.
Route only material, uncertain, inconsistent, duplicate, or policy-defined cases to review; allow low-risk validated records to enter a staged status rather than final posting; preserve rejected payloads and reasons; learn from reviewed corrections through a governed evaluation process; and monitor auto-accept accuracy.
Problem 4Challenge
Bound an agent's delegated authority
agents
tool use
delegated authority
Scenario
An AI agent can read vendor emails, query the ERP, create vendor records, edit bank accounts, schedule payments, and send replies. Its goal is ‘resolve AP issues quickly.’ A human sees a weekly summary.
Your work
Identify why the goal and authority create unacceptable combinations.
Redesign tool permissions, checkpoints, and transaction states.
Specify logs and kill conditions needed for operation.
Need a starting hint?
The agent can receive untrusted instructions, change a payee, move money, communicate externally, and summarize its own work after the fact.
Reveal the worked solution
The broad goal encourages speed without defining evidence or risk. Email content can be malicious or mistaken. Combining communication, vendor creation, bank change, and payment scheduling collapses segregation of duties and lets the agent create and conceal a harmful path before review.
Use read-only email and ERP access initially; restrict actions to drafting and creating review tasks; separate tools and credentials; require independent approval and out-of-band verification for master changes; prohibit autonomous payment release; use staged, reversible states; enforce limits by amount, vendor, volume, and time; and prevent model text from directly becoming tool parameters without validation.
Log inputs, retrieved sources, model and prompt version, proposed plan, tool request and validated parameters, tool response, user approval, state change, and external message. Stop automatically on permission errors, unusual volume, repeated failures, source conflicts, security signals, out-of-policy requests, drift thresholds, or inability to reconcile actions.
Problem 5Challenge
Build an evaluation set for an AI accounting workflow
evaluation sets
rubrics
error analysis
Scenario
A team tests a contract-summary assistant on ten easy contracts selected by its developer. Nine summaries ‘look good,’ so the team proposes deployment to all customer contracts.
Your work
Critique the sample, labels, and ‘looks good’ criterion.
Design a representative and adversarial evaluation set with a scoring rubric.
Define deployment gates and ongoing evaluation.
Need a starting hint?
Evaluation needs known expected evidence and material error categories, not only subjective fluency judgments.
Reveal the worked solution
The sample is small, selected by the developer, excludes hard cases, lacks an independent reference answer, and uses an undefined subjective outcome. It cannot estimate rare but material failures or generalization across contract types.
Stratify by contract type, length, language, region, amendment structure, scan quality, unusual clauses, and materiality. Include absent clauses, conflicting amendments, tables, negation, drafts, and access restrictions. Qualified reviewers create reference fields and citations. Score extraction accuracy, unsupported claims, citation correctness, material omissions, uncertainty handling, consistency, time, and review burden, with severe-error categories weighted heavily.
Set maximum material-error and unsupported-claim rates, minimum citation and field accuracy, subgroup floors, security tests, and a review-capacity condition. Lock a holdout set, document changes, rerun after model or prompt updates, sample production outcomes, monitor drift and incidents, and define rollback triggers.
Chapter review
Explain before revealing
Answer each question in your own words. Then open the explanation and compare the logic, not just the vocabulary.
01When is an agent preferable to a predetermined workflow?
When the task genuinely requires adapting the number or order of steps to intermediate evidence and the value justifies the larger action space and stronger controls.
02Why separate read and write tools?
Many tasks need information but not authority to change external state. Separation supports least privilege and reduces the consequence of model error or malicious input.
03What should stop a long-running agent?
Missing evidence, changed permission, conflicting unreconciled amounts, materiality limits, suspected prompt injection, budget limits, required approval, or another defined unsafe condition.
Current AI landscape
Further reading and primary sources
AI products, standards, and legal requirements change quickly; follow the linked source for the current version and requirements.
U.S. National Institute of Standards and Technology
A concrete product example of web and file search, remote tool protocols, background tasks, and tracing in agentic systems.
Chapter 13
Part V · Generative AI
AI value, risk, governance, and work
The relevant unit of analysis is the sociotechnical system: model, data, people, process, incentives, controls, and consequences.
After this chapter, you should be able to
Evaluate AI value at the task and workflow level.
Identify reliability, privacy, security, fairness, intellectual-property, and accountability risks.
Design governance across proposal, development, deployment, monitoring, and retirement.
Connect current regulatory, standards, and professional developments to AIS control responsibilities.
Explain how AI may redesign accounting work rather than simply replace whole occupations.
Chapter roadmap
Start with the question, then build the concept
The essential question
How should an organization decide whether an AI use creates value and govern it throughout its lifecycle?
The relevant object is the sociotechnical system: model, data, tools, people, process, incentives, controls, vendor, and consequences. Governance must continue after launch because uses, users, data, threats, providers, and obligations change.
Before you begin
Understand AI systems, retrieval, tools, agents, evaluation, human review, and post-deployment records.
Distinguish a broad job title from the individual tasks and decisions within the job.
A productive reading sequence
Evaluate value at task and workflow level against a measured baseline.
Map reliability, data, security, fairness, intellectual-property, operational, legal, and accountability risks to the actual use.
Govern proposal, assessment, development, testing, approval, deployment, monitoring, change, incident, and retirement.
Consider affected people, notice, appeal, assurance evidence, and how automation changes learning and professional work.
Concepts to hold onto
Sociotechnical system
The combined system of technology, data, people, roles, incentives, procedures, controls, organizations, and consequences through which outcomes occur.
AI inventory
A maintained record of material AI models, applications, embedded features, owners, purposes, users, data, vendors, risks, status, and dependencies.
Impact assessment
A structured analysis of intended and foreseeable effects on people, rights, operations, reporting, compliance, and society before and during use.
Post-deployment monitoring
Continuous or periodic observation of actual system behavior, use, outcomes, overrides, incidents, complaints, drift, and environmental changes after launch.
Assurance boundary
The defined models, data, tools, people, processes, periods, populations, criteria, and controls included in an assurance assertion or engagement.
13.1
Find value at the task level
Occupations contain bundles of tasks. Some tasks involve language transformation, search, comparison, drafting, or classification and may be well suited to AI assistance. Others depend on physical observation, negotiation, accountable judgment, confidential relationships, or exact controlled execution. Evaluating the whole job as automatable or not automatable hides this variation.
Value can come from time saved, broader coverage, improved consistency, faster access to evidence, or new services. Claims should be compared with a baseline. Saving ten minutes on drafting may not create value if review takes twenty additional minutes or error risk increases.
Workflow redesign matters more than inserting a chat box. The organization may need better documents, metadata, approval paths, escalation, and measurement. AI can expose weaknesses in the existing information system rather than solve them.
Figure 13.1 · Task-level value analysis
Measure the complete workflow, not the speed of one generated draft
01Baseline taskCurrent time, quality, coverage, cost, and risk
02AI-assisted stepSearch, extract, classify, compare, or draft
03Human reviewVerify evidence, resolve conflict, and decide
04Downstream effectCorrections, delay, adoption, and affected outcomes
05Net valueCompare total benefit and risk with the baseline
A faster model step may create no value if evidence preparation, correction, review, or downstream rework increases.
13.2
The governance landscape
AI governance is moving from general principles toward operational expectations. NIST's generative-AI profile organizes risks and actions around the AI Risk Management Framework. NIST's 2026 work on deployed-system monitoring and agent standards emphasizes continuous observation, secure interoperability, identity, and authority. ISO/IEC 42001 frames AI governance as a management system, while ISO/IEC 42005 adds a structured approach to AI system impact assessment.
Accounting and audit guidance is also becoming more concrete. PCAOB staff outreach reported that firms were initially focused on administrative and research uses while exploring audit-planning and performance applications, with continuing concern about supervision, privacy, and security. COSO's 2026 generative-AI guidance connects new uses and risks—such as prompt manipulation, model or data drift, configuration weaknesses, and cyber threats—to auditable internal-control principles.
The European Union AI Act illustrates phased legal implementation. It entered into force on August 1, 2024; rules on prohibited practices and AI literacy began applying on February 2, 2025; and obligations for general-purpose AI models began applying on August 2, 2025. Certain transparency obligations are scheduled to apply on August 2, 2026. Timelines and implementing details can change, so organizations should verify the Commission's current guidance and obtain qualified legal advice for an actual use case.
The durable lesson is not to memorize one dated list. Accountants should maintain an inventory, classify uses by significance and jurisdiction, assign an owner for external requirements, translate those requirements into controls and evidence, and document the date and source used for the conclusion.
Figure 13.2 · Four sources of governance expectations
External requirements enter the AIS through policies, controls, and evidence
01Risk frameworksOrganize risks, measurement, management, and governance
02Control guidanceTranslate risks into auditable organizational practices
03Management standardsEstablish repeatable systems and impact assessment
04Law and regulationCreate jurisdiction- and role-specific obligations
Frameworks and laws have different authority and scope, so organizations should document which source applies to each use.
Selected current sources and their AIS question
Source
Primary management question
Illustrative AIS evidence
NIST AI RMF and profiles
How are material risks identified, measured, managed, and governed?
Risk assessment, evaluation results, monitoring plan
COSO internal-control guidance
How do AI risks map to control environment, activities, information, and monitoring?
Control matrix, owners, review evidence, incident response
ISO/IEC 42001 and 42005
How is the organization managing AI and assessing impact systematically?
Policy, inventory, objectives, impact assessment, improvement records
EU AI Act
Which role, jurisdiction, risk category, and phased obligation apply?
Classification memo, notices, instructions, technical and usage records
PCAOB observations
How are firms supervising and controlling AI-assisted audit work?
AI risks include unsupported output, incomplete retrieval, sensitive-data exposure, prompt injection, unauthorized action, discrimination, intellectual-property concerns, weak recordkeeping, vendor dependency, and performance drift. The significance depends on use. A brainstorming assistant and a system recommending payment holds require different controls.
Distinguish the model provider, application developer, deploying organization, user, data owner, reviewer, and affected party. Responsibilities can otherwise disappear between contracts and teams. A vendor may secure its platform while the customer configures excessive access or uses output for an untested purpose.
Risk assessment should include reasonably foreseeable misuse. Users may paste confidential records, rely on answers outside approved scope, or automate a manual workaround. Training and policy help, but technical restrictions and monitoring are often needed for high-risk behaviors.
Source figure · AI system lifecycle and dimensions
AI risk follows the system from planning through use and impact
The diagram prevents a model-only view of risk. An accounting use can fail through its business context, source data, model behavior, task output, deployment, monitoring, or effects on people—even when the model itself continues to operate as designed.Image credit: NIST, adapted from the OECD framework for classifying AI systems. Source: NIST AI RMF 1.0, Figure 2. Reuse terms: NIST publication and attribution notes.
Figure 13.3 · AI risk map
Risk follows the deployed use, not the model name
01ReliabilityUnsupported output, omissions, and inconsistent behavior
02DataPrivacy, provenance, quality, retention, and leakage
03SecurityPrompt injection, excessive access, and unsafe tools
04PeopleBias, automation dependence, notice, and appeal
05OperationsDrift, cost, availability, vendor, and integration failure
06AccountabilityUnclear ownership, records, review, and legal obligations
A brainstorming assistant and an agent that can change vendor records require different controls even if they use the same model.
Due diligence, contract rights, exportability, continuity plan
13.4
Govern the full lifecycle
Governance begins before development. The proposal should define purpose, users, affected parties, data, decision significance, expected value, prohibited uses, and accountable owner. Higher-risk uses require stronger evidence and approval before resources are committed.
Development governance covers authorized data, documentation, testing, security, model and prompt versions, and acceptance criteria. Deployment governance covers access, training, workflow integration, human review, incident response, and fallback. Monitoring covers performance, usage, overrides, complaints, changes, and emerging risks. Retirement covers records, dependencies, replacement, and access removal.
An inventory of AI systems and material uses is foundational. The organization cannot govern systems it does not know exist. The inventory should distinguish experimentation from production and identify embedded AI features in ordinary software.
Source figure · NIST AI RMF Core
AI risk management combines governance with map, measure, and manage
Govern is cross-cutting: it establishes the culture, responsibilities, and processes that support mapping context, measuring risk, and managing prioritized risk throughout the AI system's life.Image credit: National Institute of Standards and Technology. Source: NIST AI Risk Management Framework 1.0, Figure 5. Reuse terms: NIST-created U.S. government work.
Figure 13.4 · AI governance lifecycle
Governance continues after approval and deployment
01ProposePurpose, owner, affected people, value
02AssessRisk, data, law, controls, alternatives
03TestRepresentative cases and acceptance criteria
04MonitorOutcomes, changes, overrides, incidents
05Change or retireReapprove, restrict, replace, or stop
Material changes, incidents, drift, or new obligations can send a use case back for reassessment or retirement.
13.5
Monitor the deployed decision system
Pre-deployment evaluation cannot recreate every production condition. Actual users ask new questions, source documents change, permissions evolve, integrations fail, attackers adapt, and providers update models. NIST's March 2026 report on monitoring deployed AI systems emphasizes that observation after launch is necessary because important failures emerge only in operation.
Monitoring should connect technical signals to business outcomes. Track retrieval failures, unsupported claims, tool errors, access denials, latency, cost, overrides, reviewer disagreement, complaints, affected-group outcomes, and downstream corrections as appropriate. A low technical error rate can still hide a material accounting failure if the errors concentrate in large or unusual transactions.
Define triggers before launch. A trigger may require investigation, temporary restriction, re-evaluation, reapproval, vendor notice, affected-party notice, rollback, or retirement. An incident process should preserve evidence, contain harm, identify root causes across people and systems, correct records, and feed lessons into controls and training.
Figure 13.5 · Monitoring and incident response
Monitoring turns deployed outcomes into control action
01ObservePerformance, use, overrides, complaints, and changes
02DetectCompare signals with defined triggers
03ContainRestrict use, access, actions, or affected outputs
04CorrectRepair records, configuration, data, process, or model
05LearnUpdate tests, controls, training, and approval
Signals are useful only when thresholds, owners, investigation steps, containment, correction, and reapproval are defined.Check your understandingWhat is the difference between monitoring model performance and monitoring the deployed system?
Model monitoring measures model behavior. System monitoring also observes data, retrieval, permissions, tools, user behavior, human review, business outcomes, affected people, incidents, and provider or workflow changes.
13.6
Assurance follows claims, evidence, and control boundaries
An assurance engagement begins with the claim and criteria. 'Our company uses responsible AI' is too vague to test. A more testable assertion might state that all production AI uses affecting vendor payments are inventoried, risk-assessed, restricted from direct posting, evaluated before release, and monitored under specified policy during a stated period.
The practitioner should understand the full boundary: provider model, application, data and retrieval, connected tools, user permissions, manual review, monitoring, and downstream systems. Evidence may include inventory records, contracts, configuration exports, evaluation cases, access logs, traces, approvals, incident tickets, override analyses, and reperformance. Management representation alone is weak evidence when system-generated evidence is available.
AI can also affect the reliability of audit evidence itself. A generated summary may help a reviewer navigate a contract population, but the source contracts remain the evidence and the extraction process must be evaluated. If an agent collected or transformed evidence, the auditor considers completeness, accuracy, authorization, lineage, and whether the agent's actions altered the source environment.
Figure 13.6 · Assurance over an AI use
Assurance begins with a testable assertion and a defined system boundary
01Assertion and criteriaWhat management claims, for which population and period
02System boundaryWhich models, data, tools, people, and processes are included
03Control designHow risks are prevented, detected, corrected, and monitored
04Operating evidenceLogs, traces, approvals, evaluations, incidents, and reperformance
05ConclusionResults, exceptions, limitations, and reporting
Evidence should cover the provider, application, data, tools, permissions, human review, monitoring, and downstream action included in the assertion.
Define the assertion, criteria, period, population, and system boundary.
Identify which controls are performed by the provider, customer, application, and reviewer.
Prefer direct, system-generated, and reperformed evidence over polished narrative.
Test exceptions and changes, not only normal demonstrations.
Report limitations when evidence, criteria, or responsibility is unclear.
13.7
Fairness, explainability, and affected people
A system can create unequal consequences through data, labels, features, thresholds, workflow, or human response. Equal overall accuracy does not ensure equal error patterns. The relevant fairness question depends on context, rights, and harm, and may not be reducible to one metric.
Explainability should serve a purpose. Developers may need feature behavior and failure analysis. Reviewers may need evidence and reasons. Affected individuals may need understandable notice and a way to challenge an outcome. A complex explanation that no recipient can use is not effective transparency.
Governance includes appeal and correction. If an employee expense is flagged or a customer receives a credit decision, the process should define how errors are corrected and how repeated failures are identified. Human involvement does not automatically cure systematic bias.
Figure 13.7 · From model output to an affected person
Fairness can change at every step of the decision process
01Data and labelsWho is represented, omitted, or measured differently?
02Model scoreWhich patterns and error rates emerge?
03Threshold and workflowWhich score triggers attention or action?
04Human responseHow are evidence and context interpreted?
05Notice and appealCan the person understand, challenge, and correct?
Equal model accuracy does not guarantee equal consequences when thresholds, review, communication, and access to appeal differ.
13.8
Law and policy are changing control requirements
AI-related obligations can arise from privacy, employment, consumer protection, discrimination, intellectual property, records, sector regulation, contracts, and professional standards. Requirements vary by jurisdiction and use and continue to change. This book therefore treats legal status as a monitored control requirement rather than a fixed checklist.
The organization should identify applicable obligations with qualified legal and compliance professionals, translate them into system and process requirements, assign owners, and monitor changes. Contracts should address data use, confidentiality, security, incident notice, intellectual property, audit rights, service changes, and exit.
Recordkeeping deserves early design. If a consequential decision uses AI, the organization may need to preserve the inputs, relevant source version, system version, output, human review, final action, and notice. Reconstructing this evidence later may be impossible if the system was designed as an ephemeral conversation.
Figure 13.8 · Turning an external obligation into a control
Legal monitoring is an information-system process
01Identify sourceJurisdiction, role, use, date, and authoritative text
03TranslateConvert obligation into data, process, notice, and control requirements
04Operate and evidenceAssign owners and retain proof of compliance
05Monitor changeReassess when law, guidance, system, or use changes
A dated legal conclusion becomes operational only when it is translated into requirements, owners, evidence, and change monitoring.Check your understandingWhy should a course website avoid presenting one permanent AI-law checklist?
Because obligations differ by use and jurisdiction and change over time. A durable governance approach assigns responsibility for identifying, translating, and monitoring applicable requirements with qualified professionals.
13.9
Accounting work will be redesigned
AI can reduce time spent searching, formatting, drafting, and performing routine comparisons. This may increase the importance of process understanding, data judgment, control design, verification, communication, and accountability. Entry-level work may change significantly because many traditional learning tasks are also automation candidates.
Organizations should preserve pathways for developing expertise. If junior staff no longer prepare the first draft or perform routine reconciliations, they still need opportunities to inspect evidence, understand exceptions, receive feedback, and build professional skepticism. Efficiency without learning can weaken the future review layer.
Accountants should learn to collaborate with systems without surrendering responsibility. Valuable skills include framing questions, evaluating sources, understanding data lineage, designing controls, interpreting uncertainty, recognizing when to escalate, and explaining conclusions to affected people.
Figure 13.9 · Accounting work redistribution
Automation removes some steps while making other capabilities more important
01Reduced effortSearch, formatting, first drafts, routine comparison, and extraction
02Increased effortEvidence evaluation, exception resolution, control design, and communication
03New responsibilitySystem selection, data lineage, evaluation, monitoring, and escalation
04Learning requirementPractice underlying work, receive feedback, and build skepticism
Organizations should protect learning pathways so junior staff develop judgment rather than merely approving work they never learned to prepare.
Worked case
Govern an AI system that prioritizes accounts-payable alerts
Northstar proposes an AI system that summarizes supporting records and ranks rule-generated payment alerts before reviewers investigate them. The system will not release payments or change vendor data, but low-ranked alerts may receive less timely review.
Define value and baseline
Measure current alert volume, aging, reviewer hours, confirmed findings, severity, missed cases, payment delays, and downstream corrections. State whether expected value comes from speed, coverage, consistency, or better evidence access.
Classify the use and affected parties
Identify business owner, system owner, data owner, reviewers, vendors, model and application providers, and internal-audit users. Assess how prioritization could delay legitimate vendors or hide material exceptions.
Set pre-deployment evidence
Test representative and difficult alerts, historical failures, source support, completeness, ranking stability, security, access, subgroup and vendor effects, reviewer capacity, fallback, and unacceptable outcomes against approved criteria.
Monitor the deployed system
Track ranking distributions, retrieval failures, unsupported claims, override, alert aging, confirmed severity by rank, missed cases, complaints, provider changes, drift, and reviewer behavior. Compare with baseline and pilot expectations.
Define triggers and accountability
Predetermine when to investigate, restrict, roll back, re-evaluate, notify, correct records, or retire. Preserve incident evidence and keep final responsibility with named organizational owners rather than the model or vendor.
What the case establishes
A read-only ranking system can still change which exceptions receive attention. Governance therefore covers workflow consequences, affected vendors, reviewer behavior, monitoring, and escalation—not only model accuracy.
Common misconceptions
Ideas that sound plausible—but need correction
“Low-risk AI does not need an inventory entry.”
Proportionate documentation may be lighter, but the organization still needs visibility into purpose, owner, data, vendor, status, and prohibited escalation of use.
“Passing a pilot proves the system is safe in production.”
Production introduces new users, data, integrations, attacks, incentives, provider changes, and consequences. Monitoring and change control remain necessary.
“Fairness is one model metric.”
Fairness depends on context and can be affected by data, labels, features, thresholds, workflow, human response, notice, correction, and unequal consequences.
“AI will replace or preserve an entire accounting job uniformly.”
Jobs contain varied tasks. Automation redistributes preparation, review, communication, evidence work, system oversight, and learning opportunities.
Mastery practice
Work the problem before opening the solution
Evaluate AI as a sociotechnical system. Define the affected people and decisions, baseline the current process, connect risks to controls and owners, and specify monitoring and appeal before deployment.
Problem 1Foundation
Create an AI system inventory record
AI inventory
ownership
risk classification
Scenario
A finance team begins using a browser-based AI tool to summarize confidential customer contracts. No software purchase was required, and outputs are pasted into revenue memos.
Your work
Explain why the use belongs in an AI inventory even if it is not an IT-managed application.
Specify inventory fields and initial risk classification factors.
Recommend immediate containment and assessment actions.
Need a starting hint?
Inventory follows consequential use and data flow, not procurement status or whether the tool is called a pilot.
Reveal the worked solution
The use handles confidential data and influences financial-reporting analysis. Shadow adoption does not reduce impact; it reduces visibility and control, which makes inventory more important.
Record purpose, business owner, technical owner, users, population, data types, vendor and model, deployment method, sources, outputs, downstream decisions, permissions, human review, retention, regions, third parties, risk tier, approvals, evaluations, incidents, and retirement status. Risk factors include confidentiality, financial-statement impact, scale, autonomy, reversibility, affected customers, and ability to verify output.
Pause sensitive uploads if terms and controls are unknown, preserve facts without blaming users, identify affected contracts and memos, review vendor data handling and access, assess output reliance, establish an approved alternative, notify security/privacy/legal/accounting governance as appropriate, and document remediation.
Problem 2Challenge
Perform an impact assessment for employee monitoring
impact assessment
stakeholders
appeal
Scenario
Northstar proposes a model that ranks accounting employees by ‘error risk’ using journal corrections, login times, training completion, manager ratings, and email-response speed. Rankings will influence audit sampling and performance discussions.
Your work
Identify affected people, decisions, benefits, and potential harms.
Challenge the validity and appropriateness of the features and label.
Design participation, notice, review, correction, and appeal mechanisms.
Need a starting hint?
A convenient measurable proxy can encode workload, role, disability, caregiving, time zone, managerial bias, or process failures rather than individual error propensity.
Reveal the worked solution
Employees, managers, HR, audit, compliance, and indirectly customers are affected. Potential benefit is focused support or review; harms include surveillance, stigma, biased evaluations, chilling behavior, false accusations, privacy invasion, and self-reinforcing scrutiny.
Journal corrections can reflect complex assignments or healthy detection; login time and response speed can encode schedules and accommodations; ratings can carry bias; training completion may reflect assignment timing. ‘Error risk’ needs a valid outcome definition, and individual ranking may not be necessary or proportionate to audit sampling.
Consult affected groups and HR/legal/privacy experts; provide clear notice and purpose limits; minimize data; prohibit sole automated performance action; let employees inspect and correct relevant data; require contextual manager review; create an independent appeal channel; log use; monitor disparate outcomes and false positives; and consider less intrusive process-level alternatives.
Problem 3Applied
Evaluate fairness with more than one metric
fairness
subgroup performance
tradeoffs
Scenario
An invoice-review model has 80% recall for domestic vendors and 55% recall for international vendors. Precision is 35% for domestic vendors and 62% for international vendors. International vendors have fewer labeled historical cases and longer confirmation delays.
Your work
Interpret the subgroup results and operational consequences.
Identify data and measurement questions before adjusting thresholds.
Propose a response that avoids treating one fairness metric as the entire decision.
Need a starting hint?
Lower international recall means more missed exceptions, while higher precision means a flagged international case is more likely to be confirmed. Label maturity may distort both.
Reveal the worked solution
The model misses 45% of labeled international exceptions versus 20% of domestic exceptions, but international alerts have higher yield. Different base rates, thresholds, data quality, and confirmation timing can create this pattern. Missed high-value international exceptions may have disproportionate consequences.
Check population and exposure, label definitions and maturity, sample sizes and uncertainty, currency and language fields, missingness, feature coverage, review practices, vendor mix, transaction value, and whether group definitions are legally and ethically appropriate.
Improve international data and labeling, report uncertainty, perform error analysis, test subgroup calibration and severity-weighted outcomes, consider group-aware thresholds only under governance, supplement with deterministic controls or broader sampling, monitor workload and treatment, and involve appropriate stakeholders. Document which harms and objectives the chosen metrics represent.
Problem 4Challenge
Respond to an AI monitoring incident
post-deployment monitoring
incident triggers
rollback
Scenario
After a model update, an AP assistant's unsupported-citation rate rises from 1% to 7%, average review time falls 20%, and users override fewer recommendations. No financial loss has yet been confirmed.
Your work
Interpret the signals and explain why faster review and fewer overrides are not necessarily positive.
Specify immediate and longer-term actions.
Define evidence required to return the updated version to service.
Need a starting hint?
Fluency can increase automation bias. A leading quality signal can justify action before a lagging financial loss appears.
Reveal the worked solution
Unsupported citations rose sevenfold, indicating a material reliability change. Faster review and fewer overrides may reflect greater usefulness, but they may also indicate users trust more fluent output and verify less carefully. Waiting for loss converts a warning into an incident.
Pause or roll back the update according to threshold policy, notify owners, preserve logs, compare versions, assess affected decisions, increase review on recent cases, identify whether retrieval, prompt, model, corpus, or interface changed, correct the cause, and communicate limitations to users.
Require representative regression-test results, restored citation and material-error performance, subgroup and edge-case checks, source-trace validation, security testing, approved change evidence, monitoring readiness, user guidance, and risk-owner authorization. Confirm that recent potentially affected cases were reviewed and corrected.
Problem 5Applied
Measure value without ignoring work redesign
baseline
business value
job impact
Scenario
A close-memo assistant reduces drafting time from 90 to 35 minutes per memo. Review time rises from 20 to 45 minutes, 8% of memos require material correction, and accountants report that locating citations is harder. Management reports a 61% productivity improvement based only on drafting time.
Your work
Calculate the change in total preparation-and-review time.
Identify omitted value, cost, quality, and workforce measures.
Design a balanced pilot conclusion and next experiment.
Need a starting hint?
The relevant unit is the completed, reviewable memo—not the first draft.
Reveal the worked solution
Baseline total time is 90 + 20 = 110 minutes. AI-assisted total time is 35 + 45 = 80 minutes, a 30-minute or about 27.3% reduction before correction and incident time—not 61%.
Measure correction time and severity, citation accuracy, rework, training, integration, vendor and compute cost, control evidence, review bottlenecks, employee learning, task shifting, user trust, downstream audit effort, and whether savings persist across memo types.
Conclude that early results show potential time savings but a meaningful correction and evidence-retrieval burden. Improve citation workflow and structured evidence, stratify by memo complexity, compare against templates or search tools, expand only to low-risk cases if thresholds are met, and preserve accountant responsibility for judgment.
Chapter review
Explain before revealing
Answer each question in your own words. Then open the explanation and compare the logic, not just the vocabulary.
01Why measure value against a baseline?
Without current quality, time, cost, coverage, risk, and review measures, the organization cannot determine whether the complete AI-assisted workflow improves outcomes.
02What belongs in post-deployment monitoring?
Model behavior plus data, retrieval, permissions, tools, usage, human review, business outcomes, complaints, affected groups, incidents, drift, vendor changes, and downstream corrections as relevant.
03Why must organizations preserve junior-staff learning pathways?
Review competence depends on experience with underlying evidence and preparation. Removing all formative work can create reviewers who cannot recognize when automated output is wrong.
Current AI landscape
Further reading and primary sources
AI products, standards, and legal requirements change quickly; follow the linked source for the current version and requirements.
Committee of Sponsoring Organizations of the Treadway Commission
The Commission’s latest guidance on Article 50 obligations that begin applying on August 2, 2026, including interaction and AI-generated-content transparency.
A newer impact-assessment standard that complements management-system governance with structured consideration of people and societal effects.
Chapter 14
Part VI · Application
Designing a controlled AIS proposal
A persuasive proposal connects a real organizational problem to evidence, process design, risk, control, evaluation, and accountable implementation.
After this chapter, you should be able to
Define an organizational problem without starting from a fashionable tool.
Map the current process, evidence, pain points, and control environment.
Design a future workflow with clear human and system responsibilities.
Specify risks, controls, success measures, and a realistic pilot.
Chapter roadmap
Start with the question, then build the concept
The essential question
How can a student turn an organizational problem into a controlled, testable, and decision-ready AIS proposal?
A strong proposal does not sell technology. It connects evidence about the current process to a future workflow, risk-control design, measurable pilot, ownership, and a recommendation management can accept, reject, or revise.
Before you begin
Be able to map events, actors, systems, data, controls, evidence, exceptions, and accounting consequences.
Understand baseline measurement, risk scenarios, control design, data lineage, analytics, and AI-system boundaries.
Distinguish a business problem, a proposed capability, and a specific product or tool.
A productive reading sequence
Define the organization, user, decision, current process, pain point, evidence, consequence, scope, and non-goals.
Map the actual current state, including spreadsheets, email, delays, exceptions, and compensating knowledge.
Design the future state with explicit roles for people, source systems, rules, retrieval, models, tools, approvals, records, and fallback.
Build a risk-control matrix and pilot with success thresholds, unacceptable outcomes, ownership, cost, and a decision rule.
Concepts to hold onto
Problem statement
A precise description of the user, decision, current process, evidence of the pain point, organizational consequence, scope, and intended improvement.
Current and future state
The actual process today and the proposed process after change, including actors, systems, data, handoffs, controls, exceptions, and outputs.
Baseline
Measured current performance against which the future process or pilot will be compared, such as time, error, backlog, coverage, cost, or findings.
Pilot
A bounded test using representative work, defined controls and measures, explicit success and stop criteria, and a planned deployment, redesign, or termination decision.
Sensitivity analysis
Examination of how the recommendation changes when uncertain assumptions such as adoption, error reduction, cost, or review time change.
14.1
Start with the organization and decision
A credible proposal names the organization or organizational type, user, decision, current process, pain point, and consequence. “Use AI in audit” is a technology theme. “Help internal-audit staff identify purchasing-policy exceptions before quarterly review so investigations begin while evidence is current” is a business problem.
Gather evidence about the current state: process documents, volumes, cycle times, error rates, interviews, system constraints, existing controls, and examples of exceptions. Avoid designing from anecdotes alone. The current process may contain compensating knowledge that is not visible in formal documentation.
Define scope and non-goals. A pilot that drafts exception summaries may be feasible; a project that autonomously investigates fraud, determines intent, and disciplines employees is not the same use. Narrow scope improves evaluation and accountability.
14.2
Map the current process and evidence
Show the process from trigger to decision and follow-up. Identify actors, systems, inputs, outputs, handoffs, delays, exceptions, and approvals. Connect each important decision to evidence. A map that omits spreadsheets, email, or manual workarounds will misrepresent how the process actually operates.
Separate symptoms from causes. Long close time may reflect late operational data, unclear ownership, repeated reconciliations, poor system integration, or excessive review. Automating one spreadsheet may shift the delay rather than remove it.
Document the baseline using measures the organization can continue to collect. Useful measures might include cycle time, backlog, error rate, coverage, rework, reviewer agreement, prevented loss, and user satisfaction. A pilot cannot demonstrate improvement without a comparison.
Figure 14.1 · Current-state map
Map the real work before proposing a new system
01TriggerWhat event begins the process?
02People and systemsWho performs each step, and where?
03EvidenceWhat input and record support each decision?
04ExceptionsWhere does work wait, fail, or leave the standard path?
05Outcome and baselineWhat result, time, error, or cost occurs now?
Include spreadsheets, email, manual workarounds, delays, and exception paths—not only the official application screens.Check your understandingWhy include the current control environment in a technology proposal?
The new system may rely on, replace, weaken, or duplicate existing controls. Understanding the baseline prevents the proposal from removing a necessary safeguard or claiming benefits already produced elsewhere.
14.3
Design the future workflow
Describe which component performs each step: source system, database query, deterministic rule, retrieval service, model, reviewer, approver, or records repository. Identify where data enter, how permissions are enforced, what happens when evidence is missing, and which actions are prohibited.
Keep generative components away from tasks that require exact deterministic execution unless their output is validated. A model may draft an explanation of a variance; a controlled calculation should compute the variance. A model may recommend a classification; authorized workflow should post the transaction.
Design exceptions and fallback before the happy path. What happens when the provider is unavailable, the source is outdated, the output is malformed, or the reviewer disagrees? A controlled system fails visibly and safely.
Figure 14.2 · Proposal logic
A strong proposal connects the problem to a testable controlled change
01ProblemWho needs which decision improved?
02EvidenceWhat proves the current-state problem?
03DesignWhat changes for people and systems?
04ControlsHow are unacceptable outcomes limited?
05PilotWhat result would justify deployment?
The tool comes after the decision, evidence, baseline, and process—not before them.
14.4
Build a risk-and-control argument
For each material failure mode, state cause, event, consequence, control, owner, timing, evidence, and response. Include operational, reporting, privacy, security, fairness, legal, vendor, and adoption risks as relevant. Do not use human review as a universal answer without defining what the human reviews.
Consider residual risk after controls. If the system can still omit relevant policy passages, the reviewer may need direct source access and the use may remain advisory. If an error could cause an irreversible payment, additional deterministic controls and authorization are necessary.
Controls affect value and cost. A proposal that requires five independent reviews for every low-risk draft may be safe but uneconomic. The design should be proportionate and explain why the residual risk is acceptable for the intended use.
Figure 14.3 · Risk-and-control argument
A proposal should show exactly how each material failure is addressed
01Failure modeWhat can go wrong, and why?
02ConsequenceWho or what is harmed?
03ControlWho acts, when, and using which criteria?
04EvidenceWhat proves the control and outcome?
05Residual riskWhat remains, and who accepts or escalates it?
Residual risk becomes visible when the proposal connects a failure mode to consequence, control, evidence, and response.
Illustrative risk-and-control matrix
Failure mode
Consequence
Control
Evidence
Wrong policy version retrieved
Incorrect exception conclusion
Effective-date and entity filters; citation review
Source ID, version, reviewer sign-off
Invoice data incomplete
Important fact omitted
Completeness reconciliation and required fields
Query totals and validation log
Reviewer rubber-stamps output
Automation bias
Sample reperformance and override monitoring
Review record and quality results
Model service unavailable
Review backlog
Documented manual fallback
Incident and backlog report
14.5
Design a pilot that can fail honestly
A pilot should test the most important assumptions with representative work. Define the population, sample, comparison, duration, success thresholds, unacceptable outcomes, reviewer qualifications, and decision after the pilot. Include ordinary cases, difficult exceptions, and historical failures.
Measure both quality and workflow. A system may draft faster but require more correction. Track source support, completeness, calculation accuracy, review time, user agreement, override reasons, alert backlog, and affected-party consequences as appropriate.
Avoid success criteria that guarantee a positive story, such as users found the demo interesting. A good pilot can lead to deployment, redesign, narrower scope, or termination. Learning that a use is not ready is a valuable result.
Source figure · Plan–Do–Check–Act
A pilot should turn evidence into the next controlled decision
Map the pilot to the cycle: plan the scope and success criteria, do the bounded test, check results against the baseline and unacceptable outcomes, then act by deploying, redesigning, narrowing, or stopping. A pilot is valuable when it supports an honest next decision—not when it guarantees approval.Image credit: Karn Bulsuk. Source: Wikimedia Commons. Reuse terms: CC BY 4.0.
14.6
Make the recommendation decision-ready
Executives need the problem, evidence, proposed change, expected value, material risks, control design, resource requirement, implementation sequence, and decision requested. Technical detail belongs where it supports confidence, not where it replaces the argument.
Quantify assumptions and show sensitivity. If expected savings depend on 60% adoption or a 30% reduction in review time, show what happens under lower performance. Identify ongoing costs for data maintenance, evaluation, training, provider services, control operation, and incident response.
State ownership. The proposal should name who owns the business outcome, data, system, controls, monitoring, and final decisions. A promising demonstration without operational ownership is not an implementation plan.
Check your understandingWhat distinguishes a consulting recommendation from a technology description?
A recommendation makes a supported choice: what the organization should do, why, under which assumptions, with what controls and resources, how success will be measured, and who is accountable.
Worked case
Develop a proposal for AI-assisted invoice-alert review
Northstar's five-person accounts-payable team reviews 18,000 monthly invoices after payment. Rule reports generate 3,000 alerts, 40 percent reflect known benign patterns, and reviewers spend 120 hours sorting evidence before investigation.
Define the problem without naming a tool
The decision is which alerts deserve prompt investigation. The problem is evidence-collection and prioritization time, not a general absence of AI. Non-goals include deciding fraud, changing vendor data, or releasing or holding payment autonomously.
Document the baseline and current controls
Measure alert volume, type, aging, reviewer hours, confirmed findings, severity, missed cases, duplicate patterns, source systems, and current approvals. Map manual spreadsheets, email requests, and existing payment controls.
Design the bounded future workflow
A controlled query retrieves alert and transaction records; approved retrieval supplies policy; a model drafts a cited summary; deterministic checks validate identifiers and totals; a reviewer confirms or rejects; monitoring compares outcomes with baseline.
Connect risks to controls
Address incomplete data, wrong policy, unsupported summary, sensitive exposure, automation bias, service outage, ranking drift, and provider change with named owners, access, validation, review, evidence, fallback, monitoring, and response.
Create an honest pilot decision
Test 200 representative historical alerts with independent cases. Proceed only if review time falls at least 20 percent, claim support reaches 98 percent, high-severity detection does not decline, and no unresolved sensitive-data incident occurs.
What the case establishes
The proposal is persuasive because it defines a measurable organizational change, preserves existing decision authority, exposes risks and costs, and allows the pilot to produce deploy, redesign, or stop outcomes.
Common misconceptions
Ideas that sound plausible—but need correction
“A compelling demo is evidence of business value.”
A demo shows possibility. Value requires representative workflow evidence compared with a baseline, including review, correction, adoption, control, cost, and downstream effects.
“The proposal should begin by selecting the best technology.”
It should begin with organization, user, decision, process, evidence, problem, scope, and constraints. Technology is selected after requirements are clear.
“A pilot is successful only if the organization deploys.”
A well-designed pilot creates reliable learning. Redesign, narrower scope, or termination can be the correct and valuable result.
Mastery practice
Work the problem before opening the solution
Produce a decision-ready proposal. Begin with a measurable process problem, preserve the baseline and current controls, and make the pilot capable of supporting deploy, redesign, or stop decisions.
Problem 1Foundation
Turn a technology theme into a problem statement
problem definition
scope
evidence
Scenario
A team proposes ‘Use generative AI in accounts payable to improve efficiency.’ Interviews reveal that reviewers spend 22 minutes per blocked invoice, 40% of that time locating purchase-order and receiving evidence, and 18% of blocks remain unresolved after five business days.
Your work
Write a specific problem statement naming user, task, population, evidence, consequence, and desired outcome.
Separate the problem from a proposed solution.
Identify questions that must be answered before setting a target.
Need a starting hint?
A good statement could still be true if AI were removed from the proposal.
Reveal the worked solution
AP reviewers handling blocked invoices spend a median 22 minutes per case, including about nine minutes locating PO and receipt evidence, while 18% remain unresolved after five business days; the organization needs to reduce evidence-retrieval and resolution time for the defined invoice population without weakening match, approval, or payment-release controls.
The problem is slow evidence location and resolution. AI search, deterministic linking, workflow redesign, better master data, staffing, and supplier requirements are alternative responses that should be compared.
Validate measurement method, distribution rather than only averages, block reasons, materiality, reviewer variation, system coverage, cost of delay, current control needs, false-release risk, seasonality, and whether evidence already has stable identifiers.
Problem 2Applied
Map current and future states with controls
process mapping
failure modes
control preservation
Scenario
Current state: clerk receives invoice, searches ERP and shared drive, documents mismatch, requests buyer response, and releases or escalates under policy. Future state: an assistant retrieves evidence and drafts the mismatch explanation before clerk review.
Your work
Map actors, systems, data, decisions, handoffs, controls, and evidence in both states.
Identify controls the future design could bypass or weaken.
Add new controls for retrieval, drafting, review, and release.
Need a starting hint?
Do not remove a manual step until you know whether it is waste, judgment, authorization, or evidence creation.
Reveal the worked solution
The current map should identify invoice intake, identity and access, ERP and drive search, source-document hierarchy, match rules, buyer communication, review criteria, release authority, escalation, and retained evidence. The future map inserts ingestion, retrieval, model drafting, validation, user interface, and logging before the clerk decision.
The assistant could retrieve the wrong entity's record, hide missing evidence, treat a draft as approved, overwrite the clerk's reasoning, encourage superficial review, or let a recommendation directly trigger release. It could also reduce evidence retained from manual inquiry.
Use permission-aware retrieval, authoritative-source labels, complete-population checks, citations, schema and amount validation, explicit missing-evidence status, read-only operation, independent user approval, unchanged payment authority, immutable logs, exception queues, monitoring, and rollback. Preserve the buyer-response and escalation path where judgment remains unresolved.
Problem 3Challenge
Design a pilot that can produce a stop decision
pilot design
success criteria
sensitivity
Scenario
A vendor offers a four-week pilot on 200 invoices selected by the implementation team. Success is defined as ‘positive user feedback and faster processing.’ No baseline, comparison group, severity rubric, or stopping rule exists.
Your work
Redesign sampling, baseline, measures, comparison, and review.
Define quantitative and qualitative success, safety, and stop criteria.
Explain how sensitivity analysis should affect the recommendation.
Need a starting hint?
A pilot should estimate value and risk under representative conditions, not merely demonstrate that the tool can produce output.
Reveal the worked solution
Select a representative stratified sample across invoice types, vendors, amounts, languages, scan quality, mismatch reasons, and periods. Freeze a baseline from the current process, use parallel or randomized comparison where feasible, prevent selection by the implementation team alone, and have qualified reviewers score outcomes blind to vendor claims.
Measure end-to-end time, evidence-retrieval time, field and citation accuracy, material errors, false release or hold recommendations, review burden, exception resolution, user experience, subgroup performance, security, and cost. Set maximum material-error and unsupported-citation rates, minimum time or quality improvement, required control operation, review-capacity limits, and immediate stops for unauthorized action, data exposure, or severe accounting error.
Recalculate value under lower volume, lower adoption, higher review time, vendor-price change, error-remediation cost, and alternative baseline improvements. A recommendation is robust only if it remains favorable across plausible assumptions; otherwise propose narrower scope, more evidence, redesign, or stop.
Problem 4Challenge
Write an executive recommendation with residual risk
recommendation
residual risk
accountability
Scenario
A pilot reduces review time 24% and meets citation targets, but performs poorly on non-English invoices, requires two additional reviewer hours per week, and depends on a vendor contract that permits 30-day prompt retention. The team wants enterprise deployment.
Your work
Choose among deploy, limited deploy, redesign, gather more evidence, or stop and defend the choice.
State conditions, owners, monitoring, and residual risks.
Write the precise decision requested from executives.
Need a starting hint?
A recommendation can recognize value while limiting population and requiring unresolved data and performance risks to be addressed.
Reveal the worked solution
A limited deployment to the validated language and invoice populations is more defensible than enterprise rollout. Exclude non-English cases, keep read-only assistance and human decision authority, confirm reviewer capacity, and resolve contract and privacy requirements before production data use.
Assign business, accounting, privacy/security, vendor, and technical owners; monitor time, material error, citation support, overrides, subgroup performance, review backlog, incidents, retention, and drift; define rollback triggers. Residual risks include automation bias, missed evidence, vendor change, retention exposure, and performance outside the validated population.
Request approval for a time-bounded, population-limited production phase subject to specified contractual protections, control completion, monitoring thresholds, and a formal expansion decision after new evidence. Explicitly do not request enterprise-wide or non-English deployment at this stage.
Chapter review
Explain before revealing
Answer each question in your own words. Then open the explanation and compare the logic, not just the vocabulary.
01What distinguishes a problem statement from a technology theme?
A problem statement names the user, decision, current process, evidence of a pain point, consequence, scope, and desired outcome; a theme merely names an area such as AI in audit.
02Why include current controls in the process map?
The new design may rely on, duplicate, replace, weaken, or bypass them. Omitting controls misstates current risk and can remove a necessary safeguard.
03What makes an executive recommendation decision-ready?
It states the supported choice, assumptions, value, risks, controls, cost, resources, sequence, ownership, measures, alternatives, and the precise decision requested.
Reference
Concept index
Use this compact index to return to the chapter where a term is introduced and applied. Definitions in AIS are most useful when read with the related process and example.